- 香农熵: 指混乱程度,越混乱,值越大
- 信息增益(information gain): 在划分数据集前后信息发生的变化称为信息增益(香农熵的差)
基尼不纯度也可度量集合的无序程度
香农熵的计算公式如下: $$ H=-\sum_{i=1}^{n}p(x_{i})log_{2}p(x_{i}) $$
- xi是目标变量的某个取值,
- H是一个数学期望
- 因为p(xi)<1,所以最后结果是正数
- 划分过后,数据的纯度更高,因此,香农熵更小,差值更大。该算法的目的就是寻找一个特征,使得数据的纯度更高
def calcShannonEnt(dataSet):
    """计算香农熵"""
    labelCounts={}
    numEntries = len(dataSet)       # 数据集的总数,用于计算比例P

    # 1. 计算出每个label对应的数量
    for line in dataSet:
        label = line[-1]
        if label not in labelCounts.keys():
            labelCounts[label] = 0
        labelCounts[label] += 1

	# 2. 使用labelCounts计算prob和H
    shannonEnt = 0.0                # 熵的初值
    for label, count in labelCounts.items():
        prob = float(count) / numEntries
        shannonEnt -= prob * log(prob, 2)
return shannonEntsplitDataSet(dataSet,0,1) 表示先选出满足条件"第0个标签的值等于0"的数据,再把数据中的第0个标签剔除掉。
>>> dataSet [[1, 1, 'yes'], [1, 1, 'yes'], [1, 0, 'no'], [0, 1, 'no'], [0, 1, 'no']]
>>> splitDataSet(dataSet, 0, 1) [[1, 'yes'], [1, 'yes'], [0, 'no']]
>>> splitDataSet(dataSet, 0, 0) [[1, 'no'], [1, 'no']]
def splitDataSet(dataSet, axis, value):
    """划分数据集。python使用引用传递列表,因此创建一个新的结果列表"""
    returnDataSet = []
    for line in dataSet:
        if line[axis] == value:
            newline = line[:axis]
            newline.extend(line[axis+1:])
            returnDataSet.append(newline)
    return returnDataSet
数据必须满足两点要求:
- 数据集必须是列表的列表,且每条数据长度相同
- 数据的最后一列是分类结果
对每个特征进行划分,找到划分后,信息增益最大的特征
- 需要遍历所有特征,计算每次的信息增益
- 特征i可能有很多取值,会产生很多分支,对每个分支计算香农熵。最后的熵取所有分支熵的数学期望。
- 信息增益=原始熵-按特征i划分后各个分支熵的数学期望
def chooseBestFeatureToSplit(dataSet):
    """寻找最好的分类特征==> 寻找分类后,信息增益最大的特征"""
    numberOfFeature = len(dataSet[0]) -1        # 最后一位不要,因为他是分类结果
    numberOfDataSet = len(dataSet)
    baseEntropy = calcShannonEnt(dataSet)       # 原始香农熵
    bestInfoGain = 0.0                          # 用于记录最大信息熵
    bestFeature = -1                            # 用于记录最大信息熵对应的特征下标

    # 对每个特征进行划分,找到划分后,信息增益最大的特征
    for i in range(numberOfFeature):
        # 1. 找到该特征的所有可能取值,去重
        values = [example[i] for example in dataSet]
        uniqueValue = set(values)
        # 2. 对于每一个取值,计算一次香农熵,信息增益就是不同取值的香农熵的数学期望
        newShannonEnt = 0.0
        for value in uniqueValue:
            splitedDataSet = splitDataSet(dataSet, i, value)
            prob = float(len(splitedDataSet)) / numberOfDataSet
            newShannonEnt += prob * calcShannonEnt(splitedDataSet)

        # 3. 寻找最大信息增益
        infoGain = baseEntropy - newShannonEnt
        if infoGain > bestInfoGain:
            bestInfoGain = infoGain
            bestFeature = i

    # 寻找最大的数学期望,返回该特征
return bestFeature递归创建决策树,递归终止的条件有两个:
- 遍历完所有划分数据集的属性(每次划分会消耗一个属性,属性已经用完)
- 该分支下所有实例都是相同的分类
def createTree(dataSet, labels):
    """创建决策树。labels 是对每个特征值的含义的解释,方便建立决策树"""
    # 递归终止条件
    classList = [example[-1] for example in dataSet]
    # (1)属性已经用完
    if len(dataSet[0]) == 1:
        majorithCnt(classList)
    # (2)所有分类已经一致
    if classList.count(classList[0]) == len(classList):
        return classList[0]

    # 1. 寻找最优特征
    bestFeature = chooseBestFeatureToSplit(dataSet)
    bestFeatureLabel = labels[bestFeature]  # 只是标签,用于建树
    mytree = {bestFeatureLabel: {}}         # 初始化树
    subLabels = labels[:]                   # 复制该列表,因为labels是引用。避免值被改变
    del subLabels[bestFeature]                 # subLabels

    # 2. 当前最优特征的所有取值,去重
    totalValues = [example[bestFeature] for example in dataSet]
    uniqueValues = set(totalValues)

    # 3. 每个value一个分支,确定每个分支的值。因为是递归,所以分支下可能还有分支(字典里可能嵌套字典),如果该分支已经可以结束,则返回返回classList中的一个(分类结果)
    for value in uniqueValues:
        subDataSet = splitDataSet(dataSet, bestFeature, value)
        mytree[bestFeatureLabel][value] = createTree(subDataSet, subLabels)
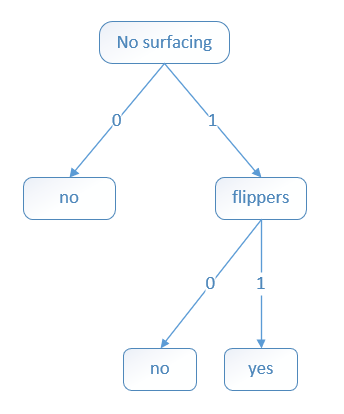
return mytree这部分很简单,将数据集按照树的结构从上往下查找即可。数据集如下:
| no surfacing | flippers | fish(目标变量) |
|---|---|---|
| 1 | 1 | yes |
| 1 | 1 | yes |
| 1 | 0 | no |
| 0 | 1 | no |
| 0 | 1 | no |
def classify(inputTree, featureLabels, testVec):
    """
    :param inputTree: 构建好的决策树
    :param featureLabels: 标签列表,也就是每个分类的属性名
    :param testVec: 测试数据
    """
    firstStr = list(inputTree.keys())[0]            # 其实根元素只有一个
    secondDict = inputTree[firstStr]                # 第二层
    featureIndex = featureLabels.index(firstStr)    # 当前属性的下标

    for key in secondDict.keys():
        if testVec[featureIndex] == key:
            if type(secondDict[key]).__name__ == "dict":
                classLabel = classify(secondDict[key], featureLabels, testVec)
            else:
                classLabel = secondDict[key]
return classLabel将决策树保存到文件中。python使用pickle模块序列化对象
pickle.dump(obj, file): 将obj写入到file中。file=open(filename,"bw")pickle.load(file): 读取file中的内容,转换为obj。file=open(filename, "rb")
def storeTree(inputTree, fileName):
    import pickle
    with open(fileName, "wb") as file:
        pickle.dump(inputTree, file)


def grabTree(fileName):
    import pickle
    with open(fileName, "rb") as file:
return pickle.load(file)准备训练数据集。该数据集有5项,4个特征变量和一个目标变量。 各个属性名分别是:
['age', 'prescript', 'astigmatic', 'tearRate']
部分数据集:
young	myope	no	reduced	no lenses
young	myope	no	normal	soft
young	myope	yes	reduced	no lenses
young	myope	yes	normal	hard
young	hyper	no	reduced	no lenses
young	hyper	no	normal	soft
young	hyper	yes	reduced	no lenses
......- 收集数据:保存数据的文本文件
- 准备数据:解析文本文件,将文件读入内存。数据包括:(1)符合规范的数据集(dataSet),(2) 数据集的属性名称列表(labels)
- 分析数据:检查数据(我也不知道咋检查)
- 训练算法:使用
createTree(dataSet, labels)生成决策树myTree - 测试算法:编写函数验证决策树
classify(myTree, labels, testVec) - 使用算法:保存决策树以供下次使用(KNN就无法做到)
- 数据集必须是二维列表 & 每条数据长度一致 & 最后一列是分类结果
- labels 必须与dataSet配套,labels保存了每个属性的属性名,用于建立易于理解的决策树。在这个案例中就是:['age', 'prescript', 'astigmatic', 'tearRate']
- classify(inputTree, labels, testVec) 训练好决策树后,就可以使用classify函数分类
简而言之:
- 准备
dataSet和labels,通过createTree(dataSet, labels)==>mytree - 准备测试数据
test,通过classify(myTree, labels, testVec)==> 结果
def lense():
    with open("dataset/lenses.txt") as file:
        fileContent = file.readlines()

    dataSet = [example.strip().split("\t") for example in fileContent]
    labels = ['age', 'prescript', 'astigmatic', 'tearRate']
    myTree = createTree(dataSet, labels)

    print("计算出的决策树是:", myTree)
    result = classify(myTree, labels, ['young', 'myope', 'no', 'reduced'])
    print("预测的结果是:", result)
计算出的决策树:
{'tearRate': {'normal': {'astigmatic': {'no': {'age': {'presbyopic': {'prescript': {'hyper': 'soft', 'myope': 'no lenses'}}, 'young': 'soft', 'pre': 'soft'}}, 'yes': {'prescript': {'hyper': {'age': {'presbyopic': 'no lenses', 'young': 'hard', 'pre': 'no lenses'}}, 'myope': 'hard'}}}}, 'reduced': 'no lenses'}}- 完整的决策树远没有这么简单。该算法只能预测离散型的结果,无法预测连续型数据
- 书中选择特征使用的是信息增益算法(ID3),除此之外,还有信息增益比(C4.5算法)、基尼指数(CART算法)。好复杂,以后再学习吧
