Coronary Heart Disease (CAD) was one of the most lethal disease in United States. In order to create an accurate model and analyze the remarkable risk factors, a data mining classification task that involes 5 different methods (logistic, LDA, QDA, Tree, SVM) is applied onn the Z-Alizadeh Sani Dataset.
The Z-Alizadeh Sani Dataset (Z-Ali Dataset) is collected by Dr. Zahra Alizadeh Sani, the Associate Professor of Cardiology at Iran University in November 2017. The dataset has 303 observations and 56 variables, This dataset is restored in UCI Machine Learning Repository: https://archive.ics.uci.edu/ml/index.php
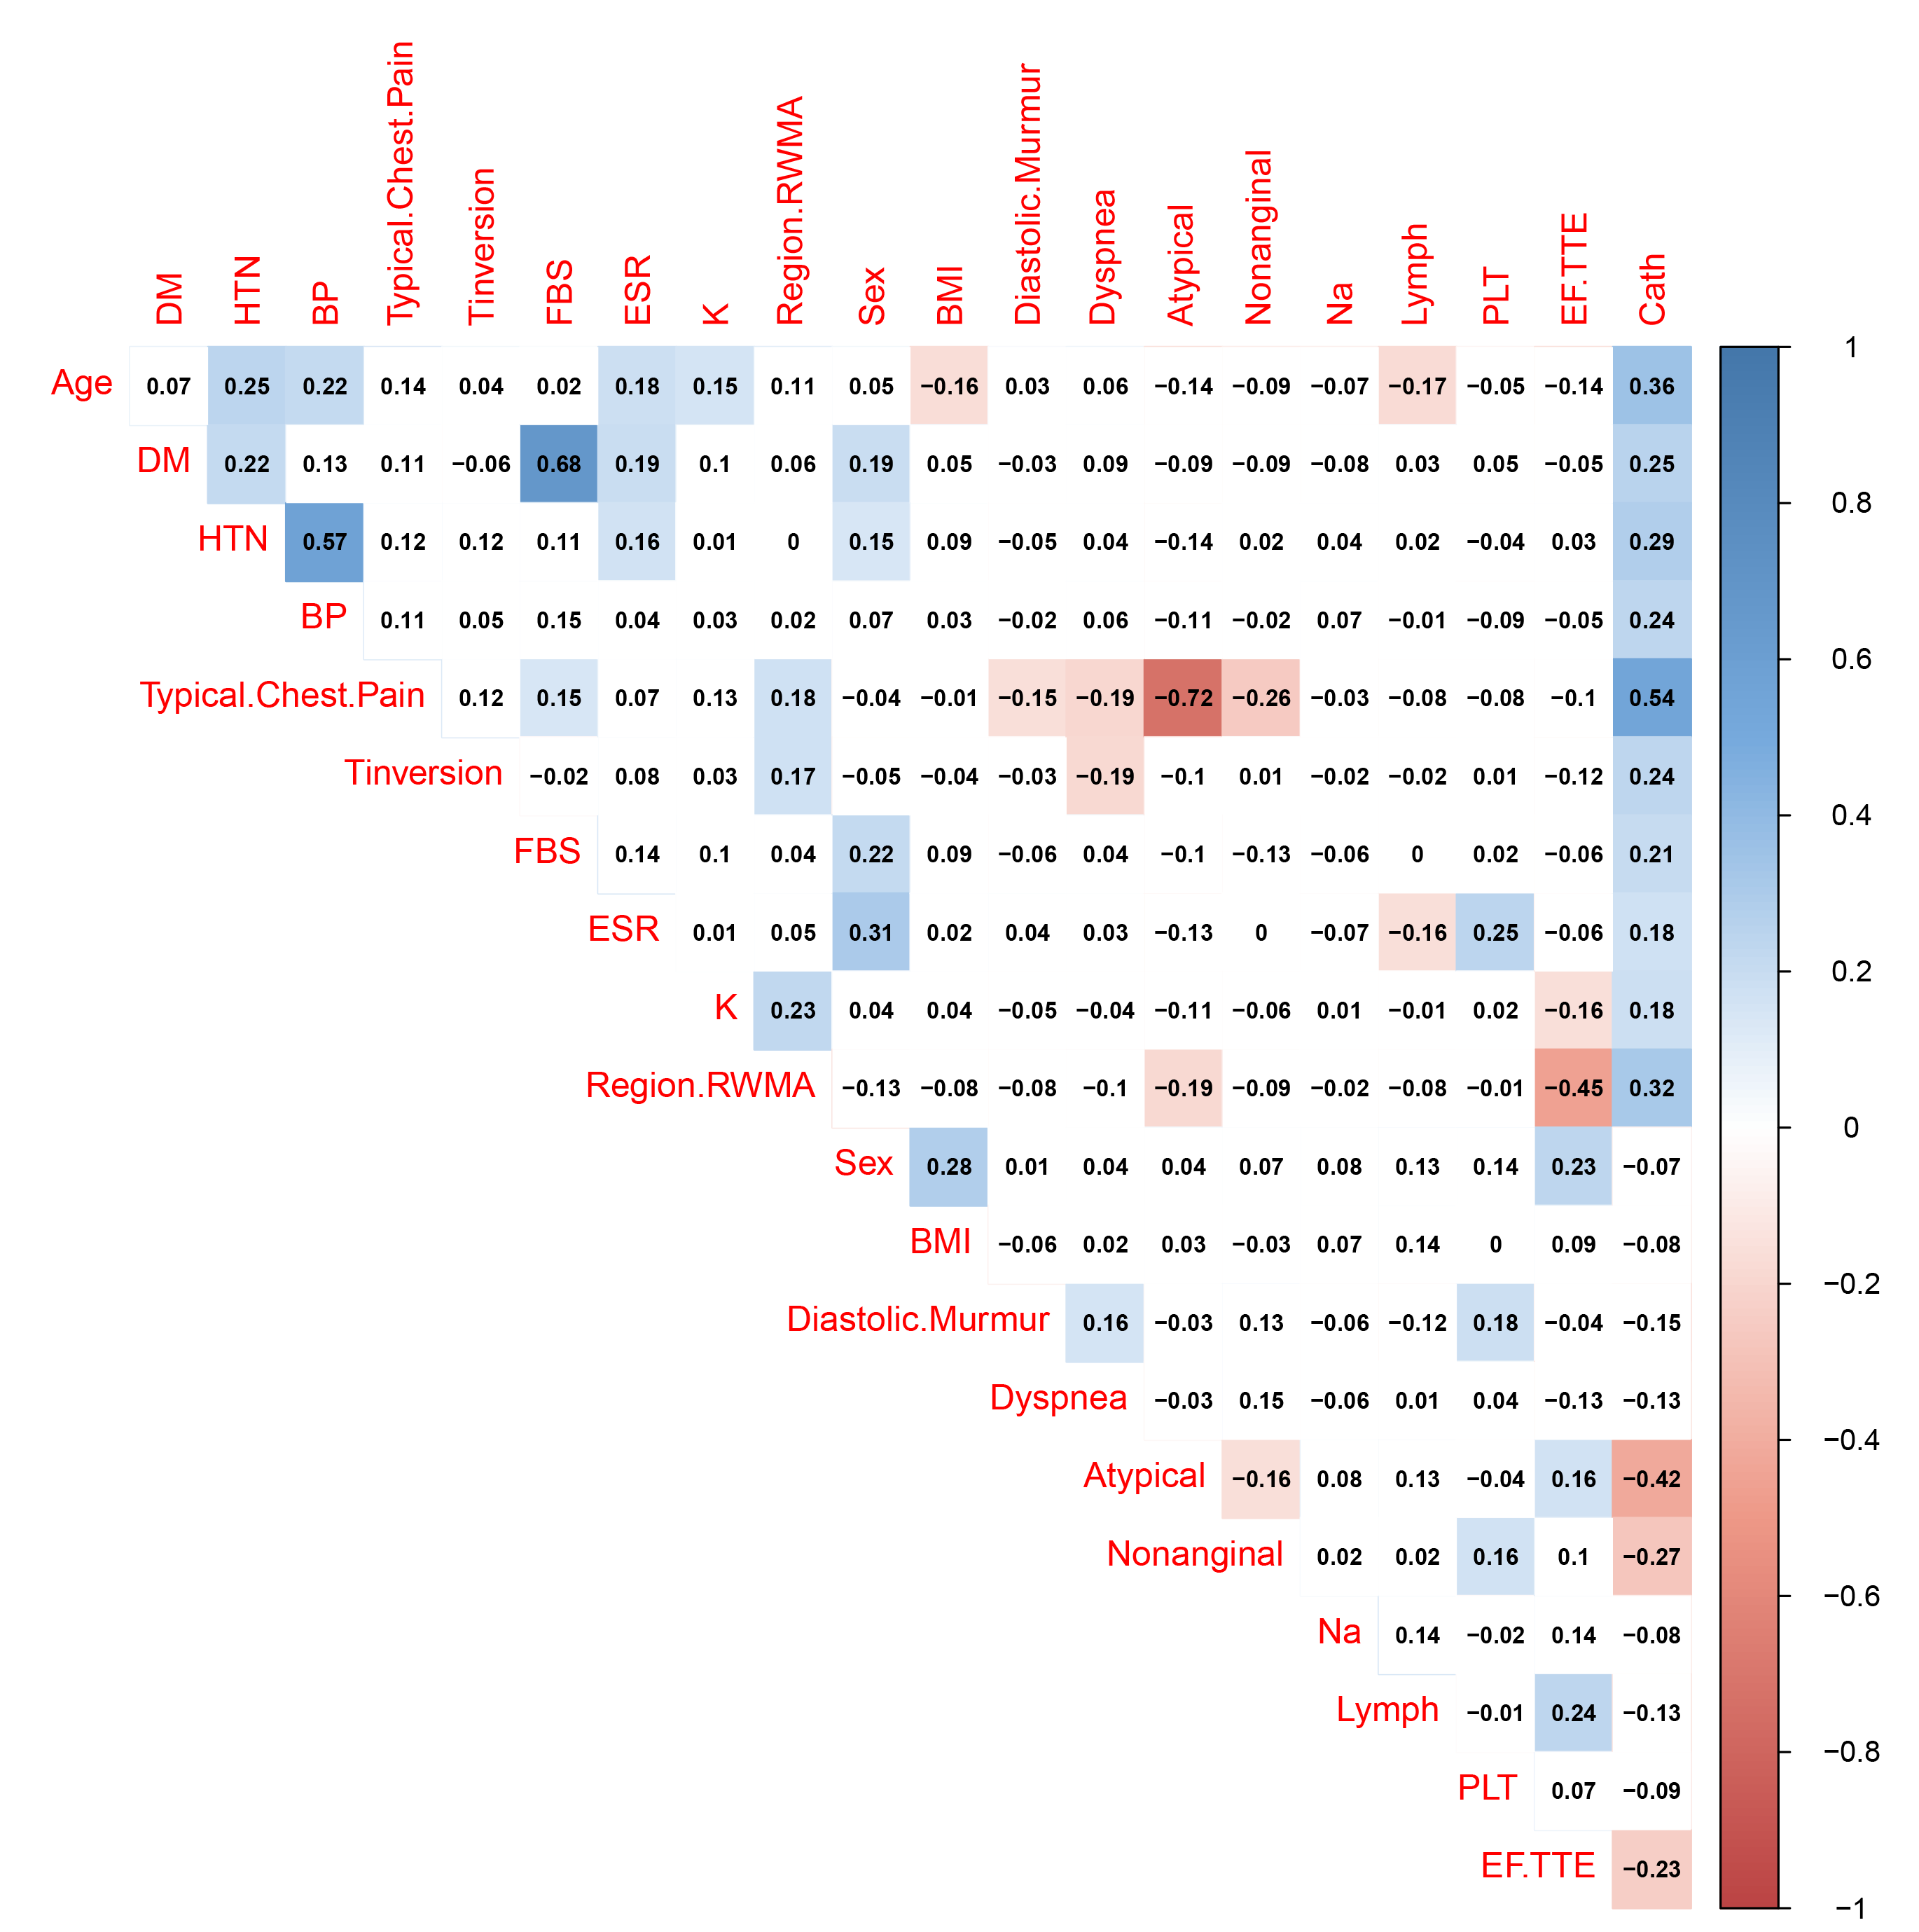
Generally, more complex model = more variance. According to correlation matrix, a lot of 55 predictors will provide invaluable or redundant information.
 Correlation matrix for Z-Ali dataset(Top 20 with "Cath")
| Variable | Frequency |
|---|---|
| Typical.Ches.Pain | 200 |
| Age | 200 |
| Atypical | 200 |
| EF.TTE | 200 |
| Region.RWMA | 179 |
| TG | 106 |
| FBS | 104 |
| HTN | 100 |
| BMI | 88 |
| Nonanginal | 69 |
| ESR | 56 |
| Tinversation | 50 |
| BP | 48 |
At the end, we are able to show that the top 8 predictors in the frequency table are valuable in CAD detection. And those 8 variable will be used to build reduced models and obtaining 10-fold Cross Validation Error:
| Classification Method | 10-fold CV Error (Full) | 10-fold CV Error (Reduced) |
|---|---|---|
| Logistic Regression | 15.86% | 13.12% |
| LDA | 14.81% | 14.46% |
| QDA | N/A | 15.75% |
| Decision Tree | 22.46% | 12.21% (Random Forest) |
| SVM (Radial Kernel) | 13.23% | 13.24% |
| SVM (Linear Kernel) | 16.47% | 13.24% |
| Average | 16.57% | 13.67% |
10-fold cross validation are performed for both full and reduced model. From the results we can conclude that: By uisng the reduced model, the misclassification decrased about 3%.
By comparing the performance of 5 different classification methods, we also can make the following assumptions:
-
Logistic Regression is not sensitive to predictors which provide redundant information. Variable selection process can significantly improve the performance.
-
LDA has problem with more categorical predictors.
-
QDA is similar to LDA. But the number of parameters will become huge as having more predictors.
-
Decision Tree with Random Forest is the best classifier for this data set. Decision tree models nonlinear relationships and handles categorical predictors effectively.
-
SVM shows a strong ability to deal with redundant information. In general, SVMs are more focused on model regulation rather than feature selection. This is the reason why the error rate with SVM almost no change after variable selection.