This project is part of an exercise/workshop designed to show how to get started with New Relic APM. The goal is to start from scratch (as in, downloading/compiling/packaging an app) to collecting telemetry, dashboards, alerts, etc. All that using the New Relic Observability Platform.
We will set up the following New Relic Components:
- New Relic Infrastructure
- New Relic APM
- New Relic Browser
- New Relic Logs
We will start by installing the New Relic Infrasctructure Agent so we can collect the host's CPI/Memory/Disk information. Then we will clone (download) a sample java application (Spring PetClinic), compile, package, and run the application.
Once the application is up and running, we will instrument the Spring PetClinic application using the New Relic APM agent that monitors the service generating traces and metrics that are reported to the New Relic Platform.
After that, we will instrument the Spring PetClinic's end-user interface (HTML pages rendered by the application) with the New Relic Browser agent that will generate telemetry about all the individual clicks and page loads executed by the end-user.
Lastly, we will configure the Spring PetClinic application to write application logs to the filesystem and the New Relic Infrastructure Agent to read (tail) the logs and report to the New Relic Platform.
Here are the core steps or tasks on this exercise:
- Prepare VM and Environment
- Login to New Relic Platform
- Install New Relic Infrastructure Agent
- Clone, Compile and Build PetClinic Application
- Install and Configure The New Relic APM Agent
- Install and Configure the New Relic Browser Agent
- Configure PetClinic Log Reporting
- Dashboarding
The exercise and instructions below use an Ubuntu VM (18.04), and the instructions to install pakages during the first steps target Ubuntu VMs. If you plan to use different Distros, make sure you have the proper command to install the dependencies.
If you are planning to run this exercise locally, in a lab format, we recommend Multipass (https://multipass.run/) or VirtualBox (https://www.virtualbox.org/). While we do not cover VM creation here, there are plenty of resources available with detailed instructions on several websites. A VM with 2GB, 1vCPU and 15gb HD should handle it.
The VM needs to have access to the the internet for both downloading installers as well as sending the telemetry to the New Relic endpoints.
Another Pre-requisite is access to the New Relic Platform. If you work for a company that uses New Relic, please check with your internal team to get access to the account.
In case you just want to try it out, you can sign up for a free account (it is a perpetually free account, no credit card necessary) here: https://newrelic.com/signup
Lastly, this exercise requires basic knowledge and familiarity with using a shell console, running commands, and editing configuration files (we are using vi here, you can use whatever editor you prefer). If you never tried that out, we recommend reading a bit around Linux shell and commands/editors before starting.
If you are creating your VM using Multipass, you can run the following command:
multipass start -n workshop -c 1 -m 1G -d 10G
(it creates a VM named 'workshop' with 1CPU, 1Gig RAM and 10Gig disk)
The first step is to log in to your VM. In the steps here, we will use the commands for multipass.
multipass shell workshop
Once you log into the VM, you will run a few commands to download required components:
    sudo apt update
    sudo apt install curl git maven openjdk-11-jdk unzip
It might take a few minutes, depending on your VM specs and network speed. The commands above will install components necessary for the exercise.
Meanwhile, you can go ahead and login to your New Relic Account.
PICTURE
And if you don't have an account, you an sign up here: https://newrelic.com/signup
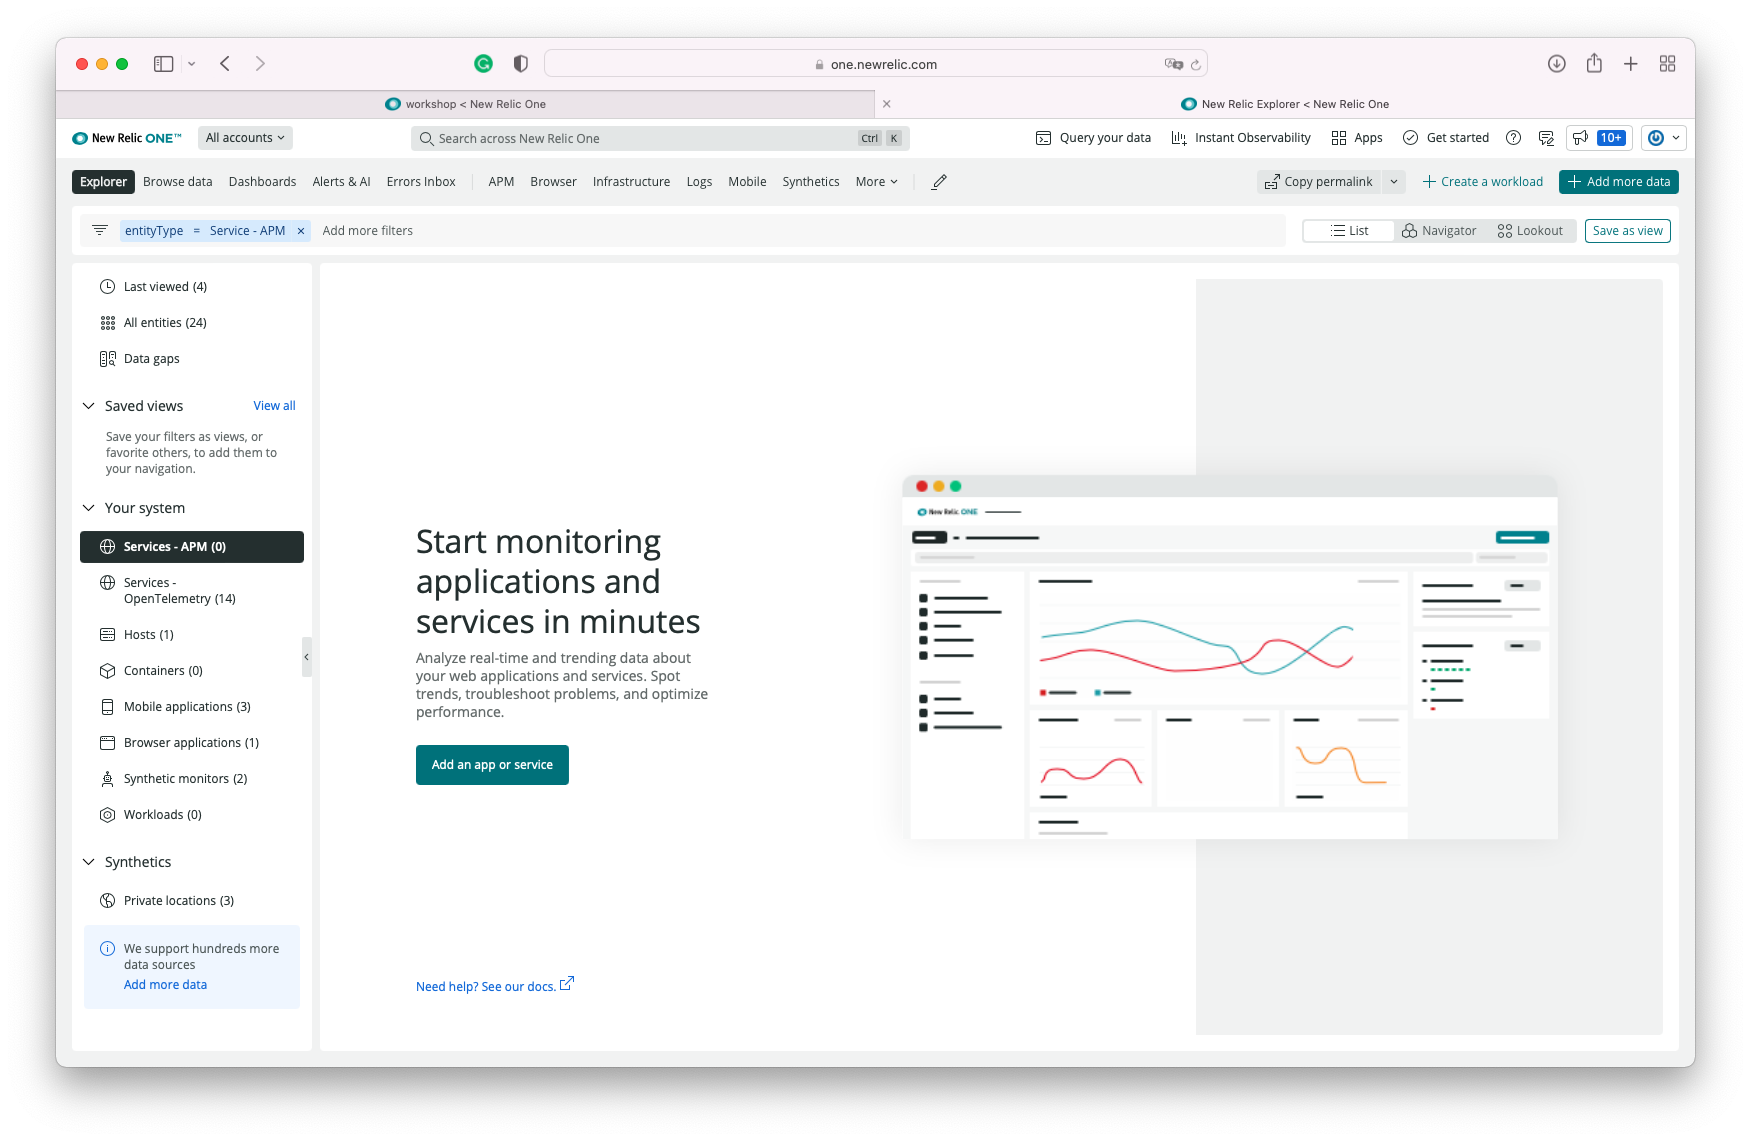
After login, you should land on a page like this:
PICTURE
Let's get started with step #1: Install the New Relic Infrastructure Agent.
The infrastructure agent is responsible for both
- Collecting and Reporting IM metrics (disk, cpu, memory, etc)
- Collecting and Reporting host and application logs
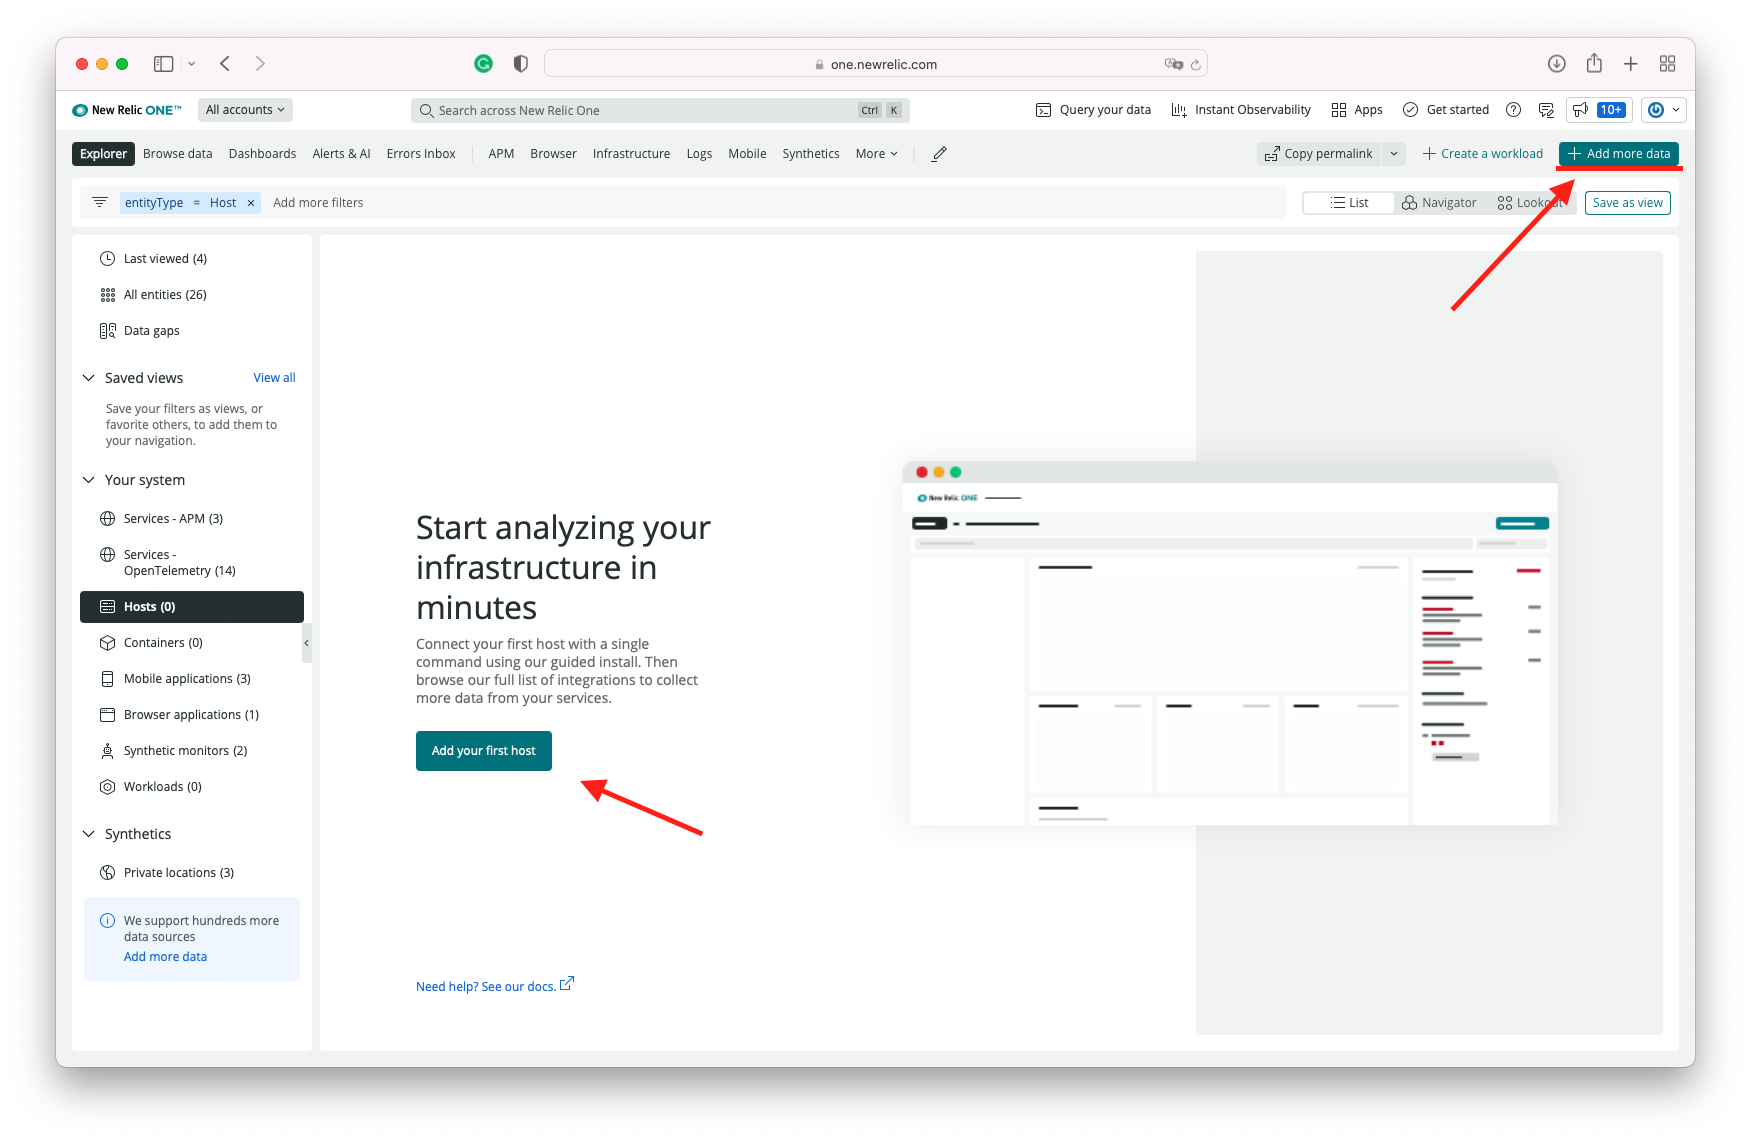
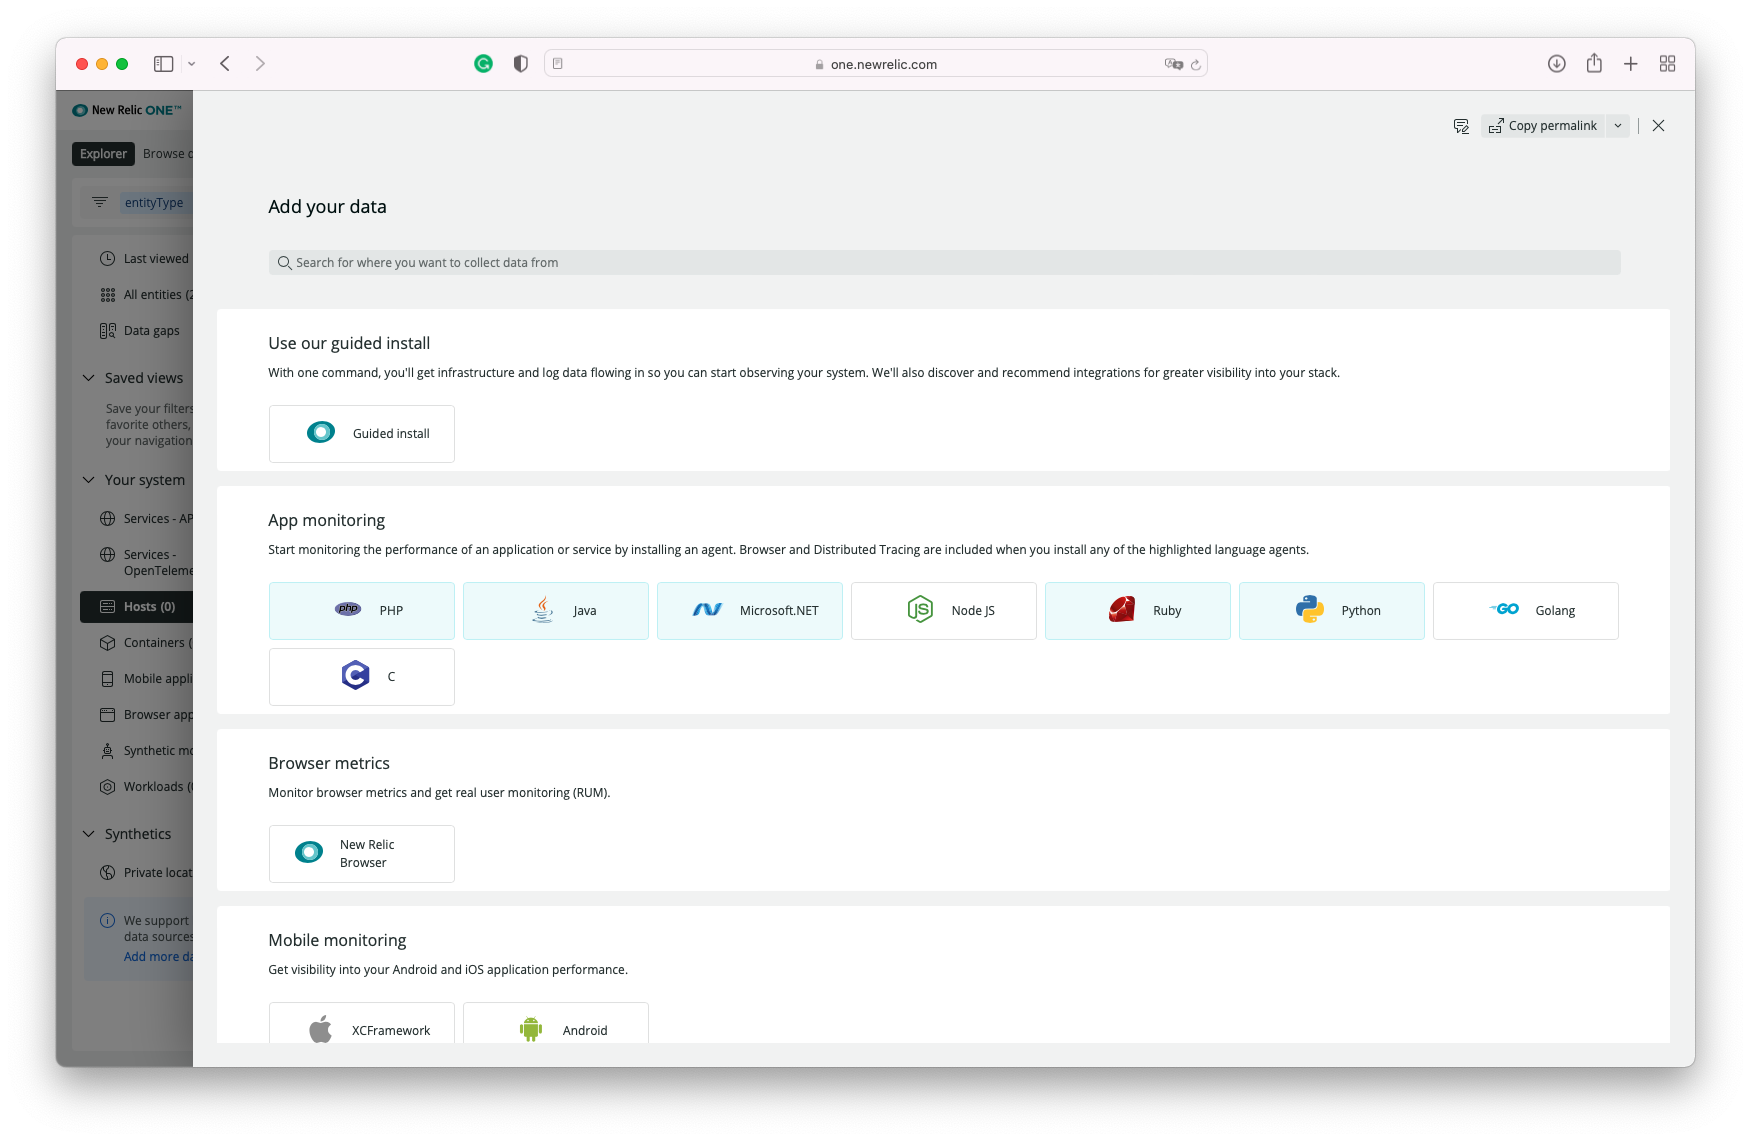
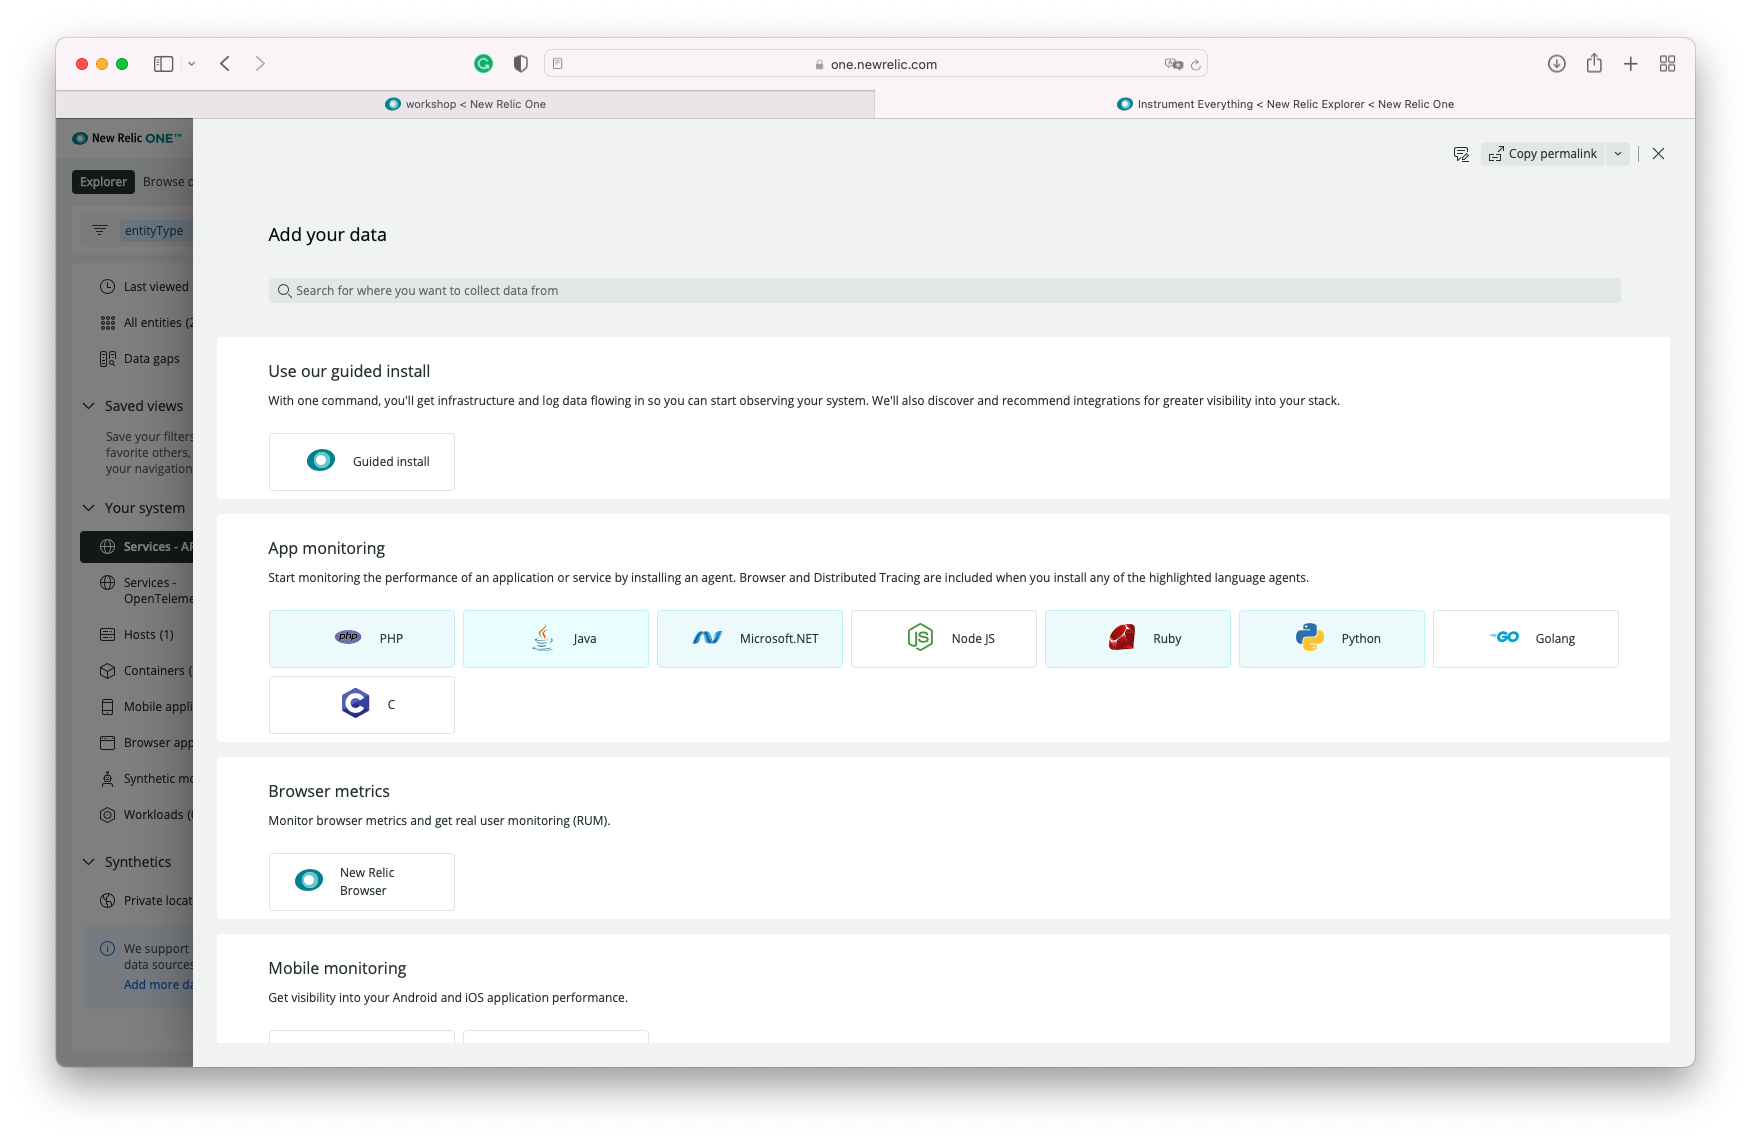
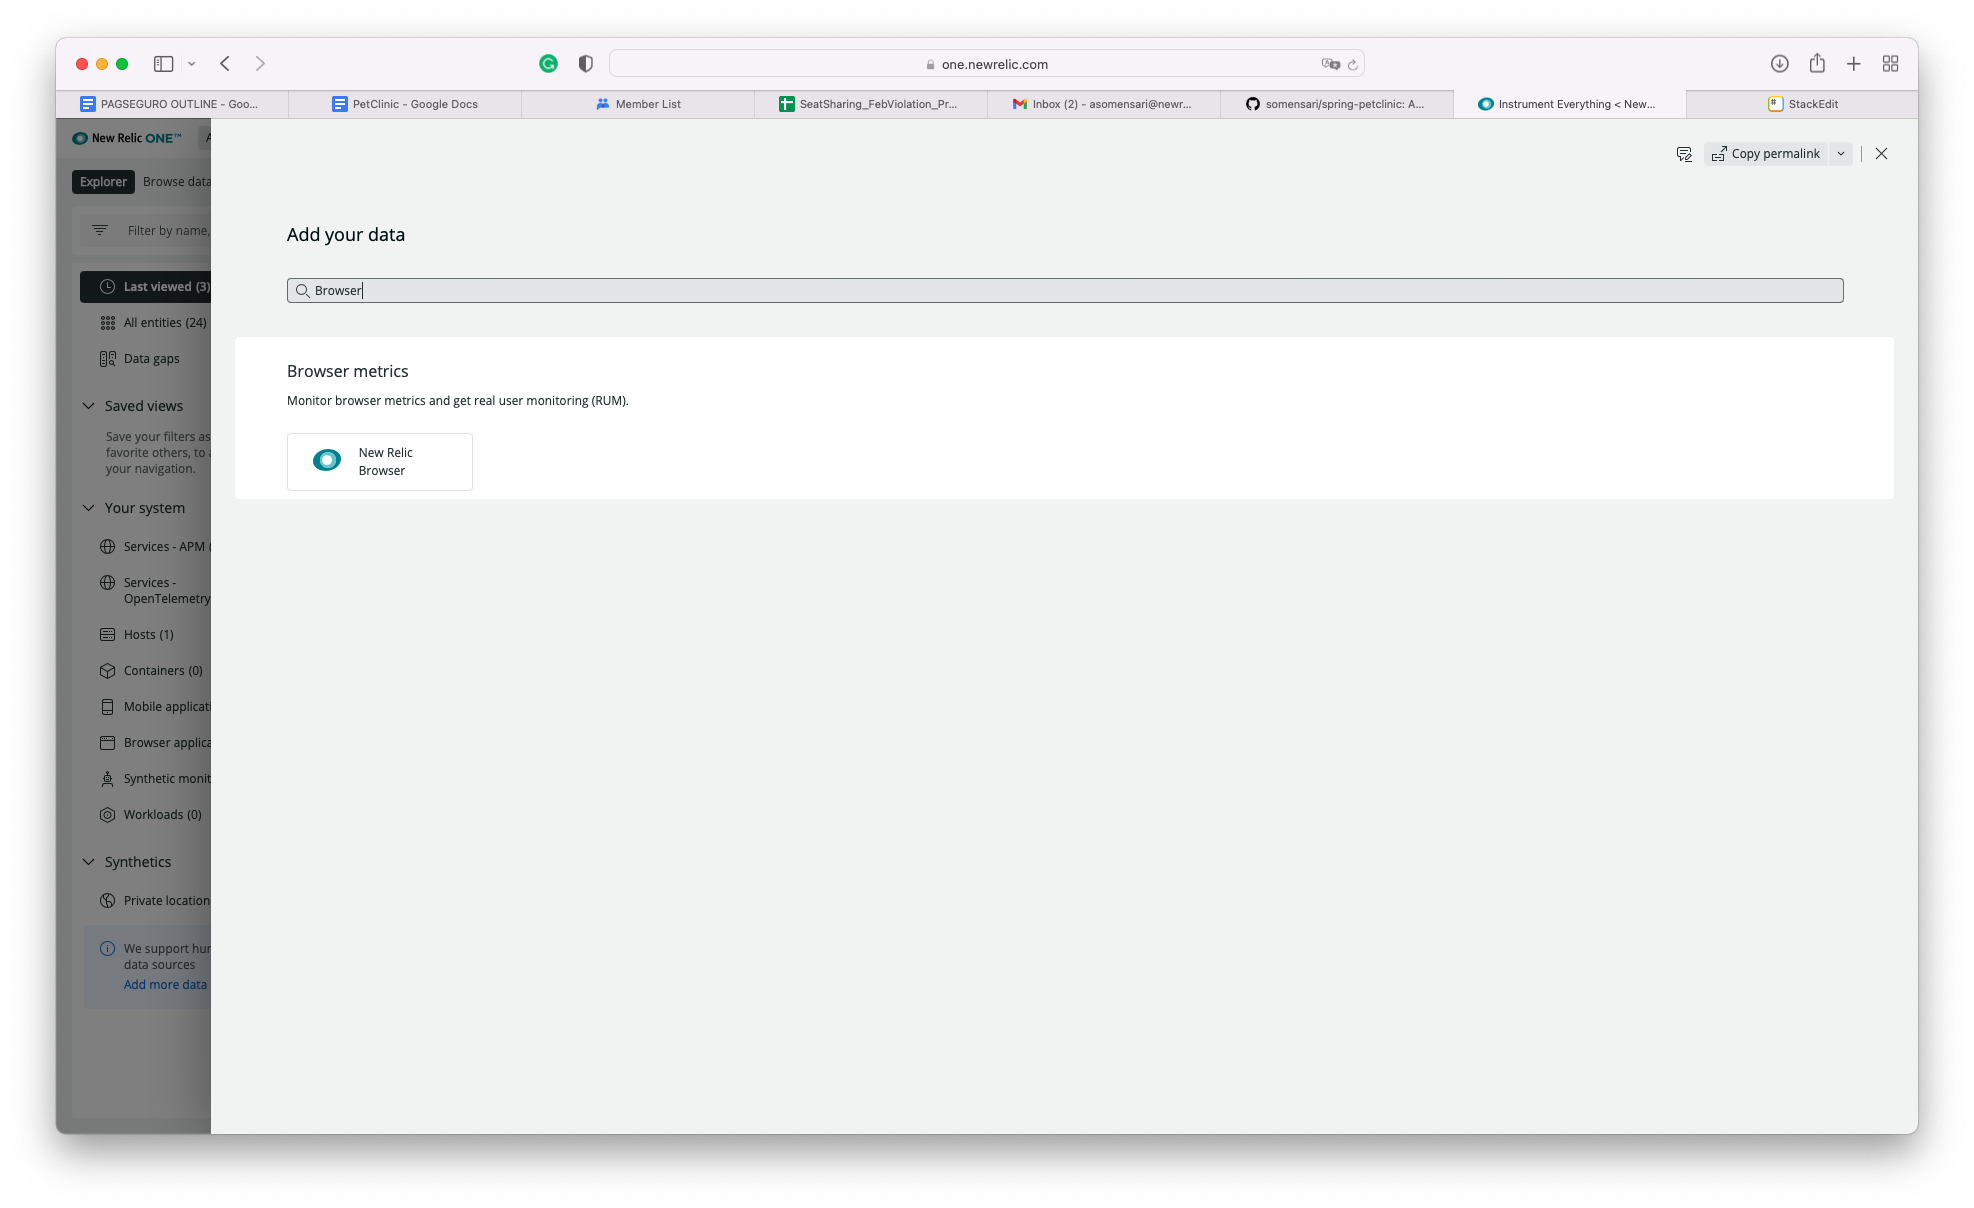
New Relic offers wizards to walk you through the setup of the agents and instrumentation. To get to the wizard, click on the top right corner icon "Add more data"
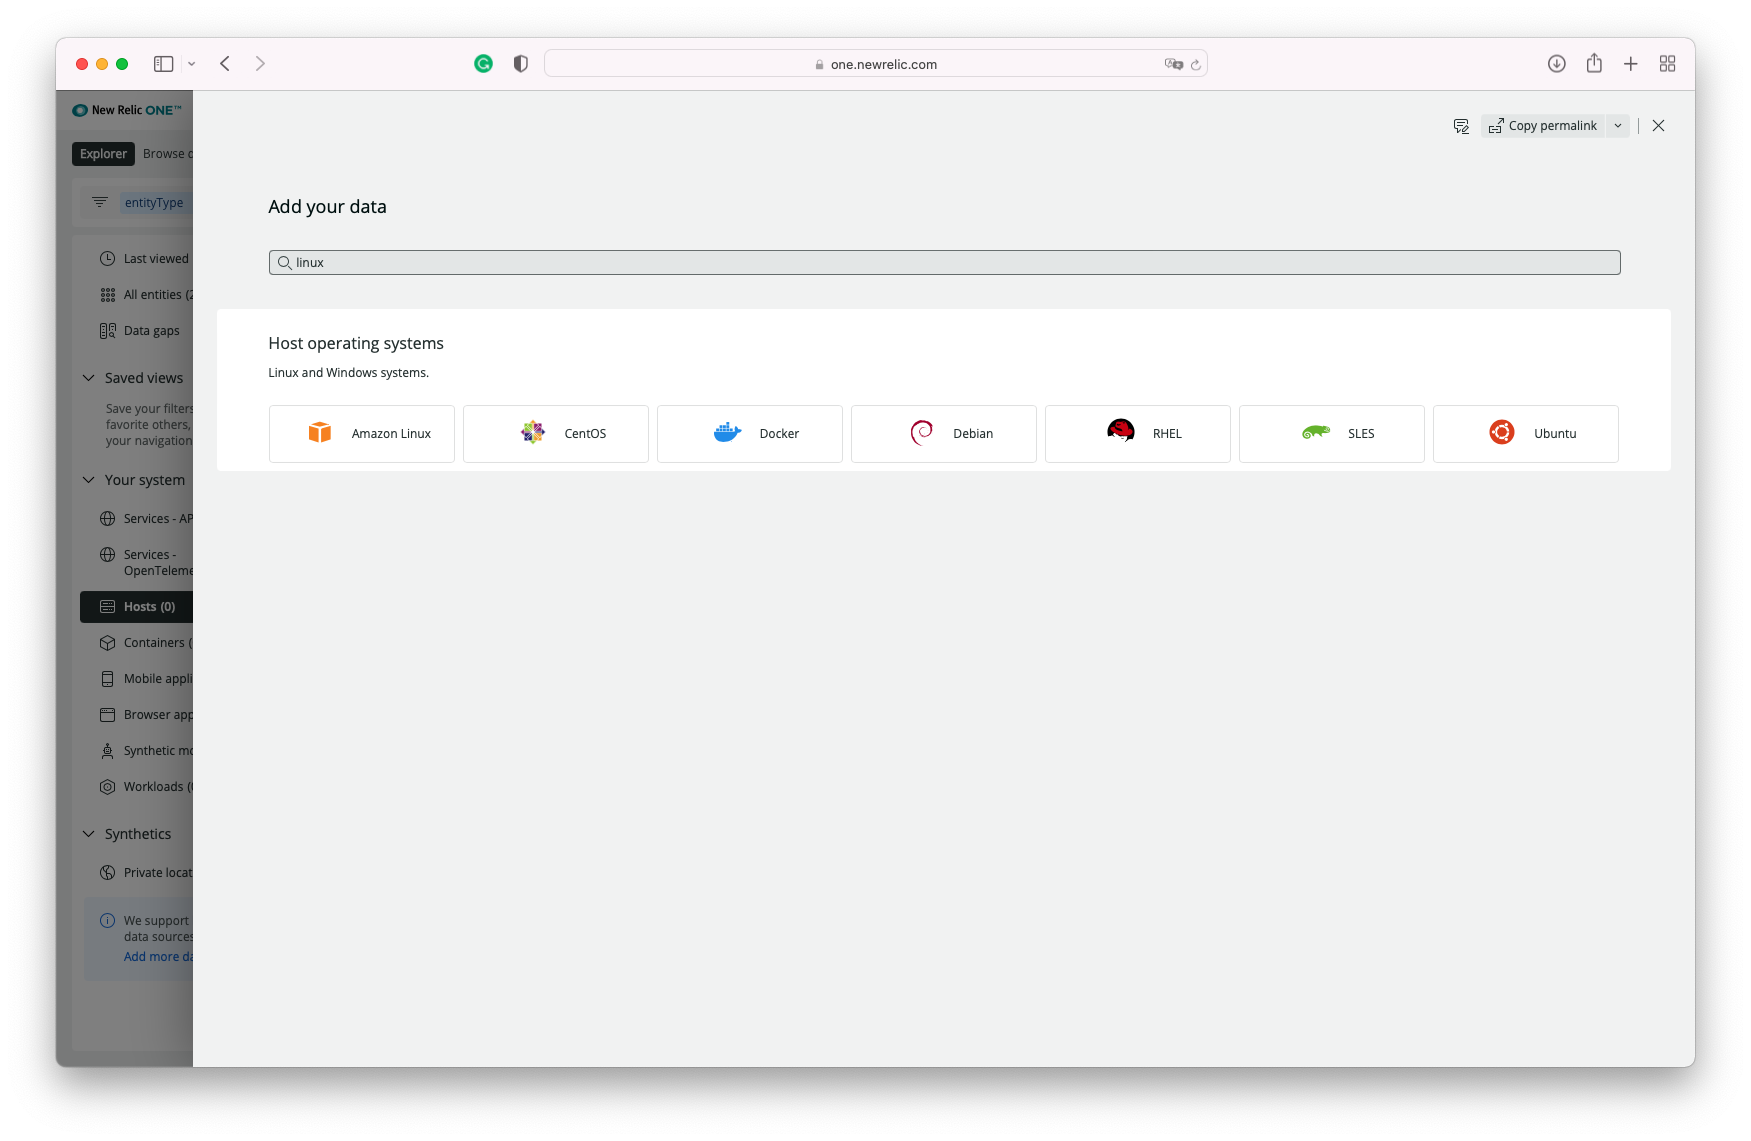
You can then type "Linux" on the search box and select the distro you are using:
Then You select the OS/Distro:
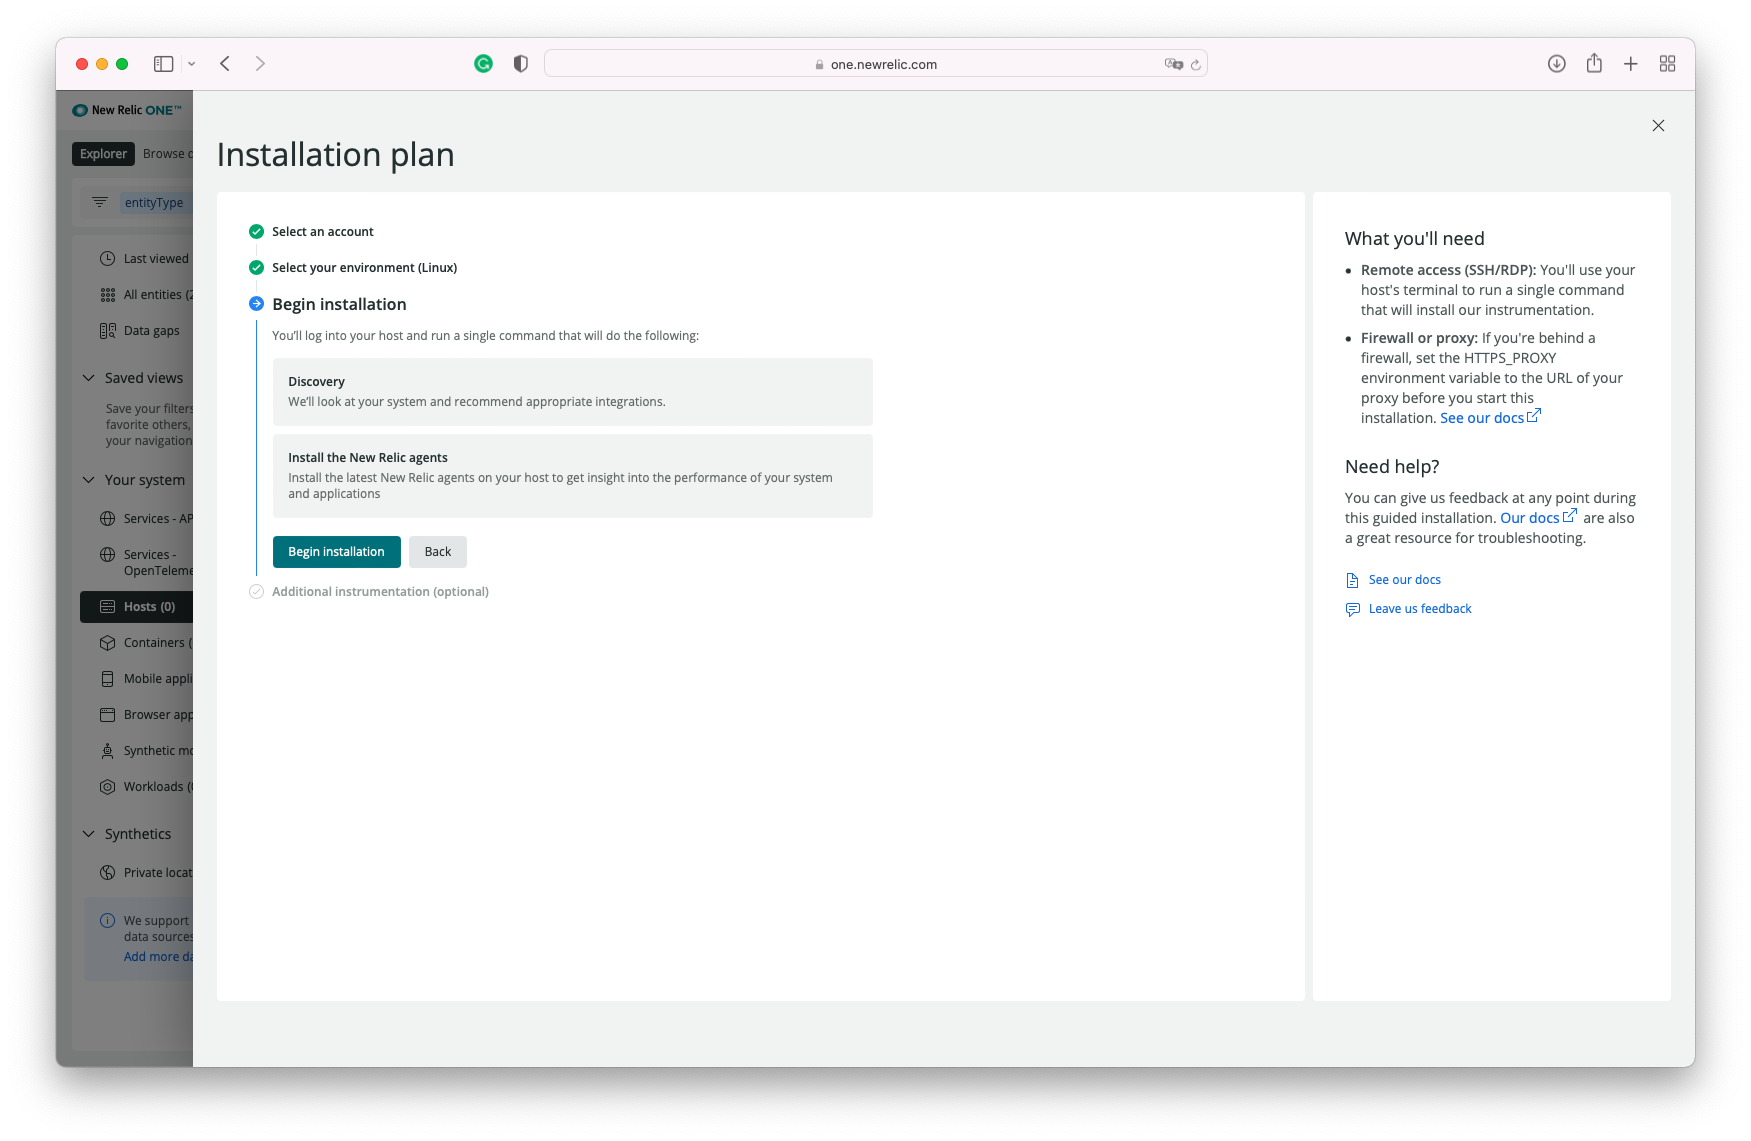
You'll be taken to a short wizard where you will select some options. The default settings should work, no need to make changes.
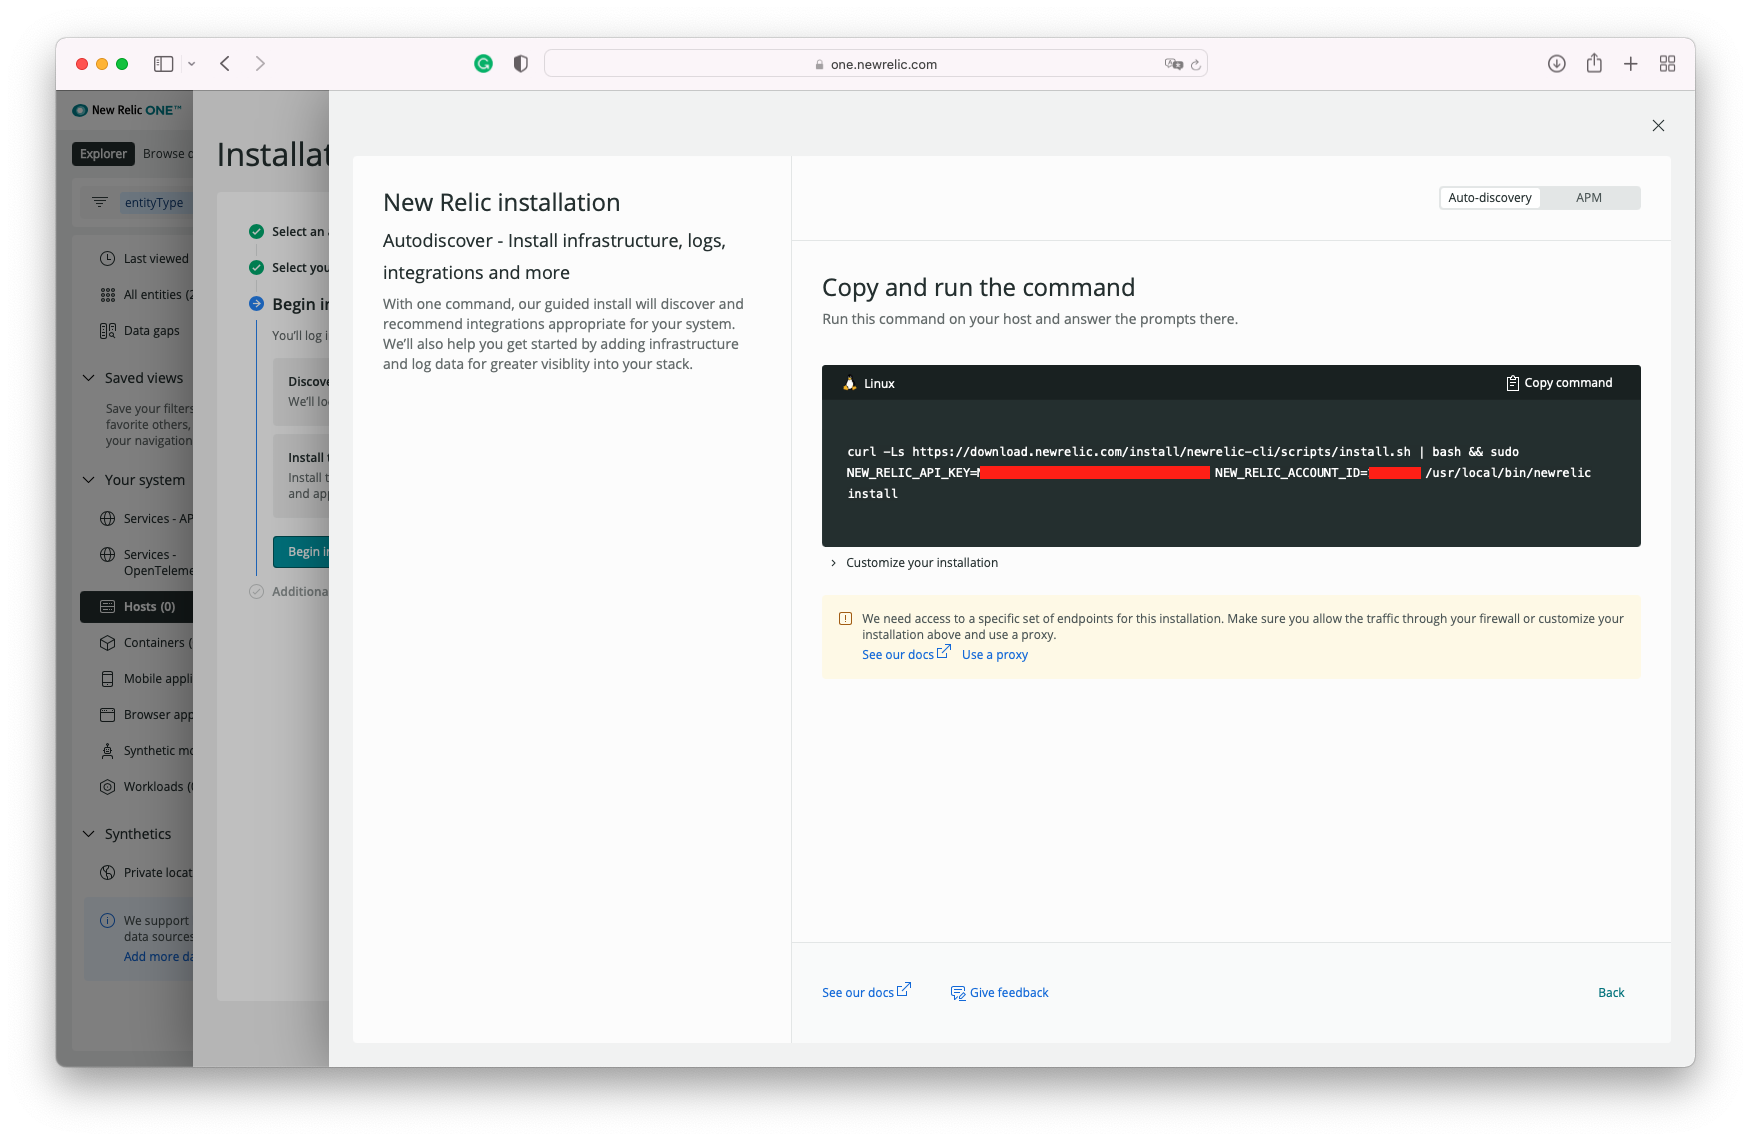
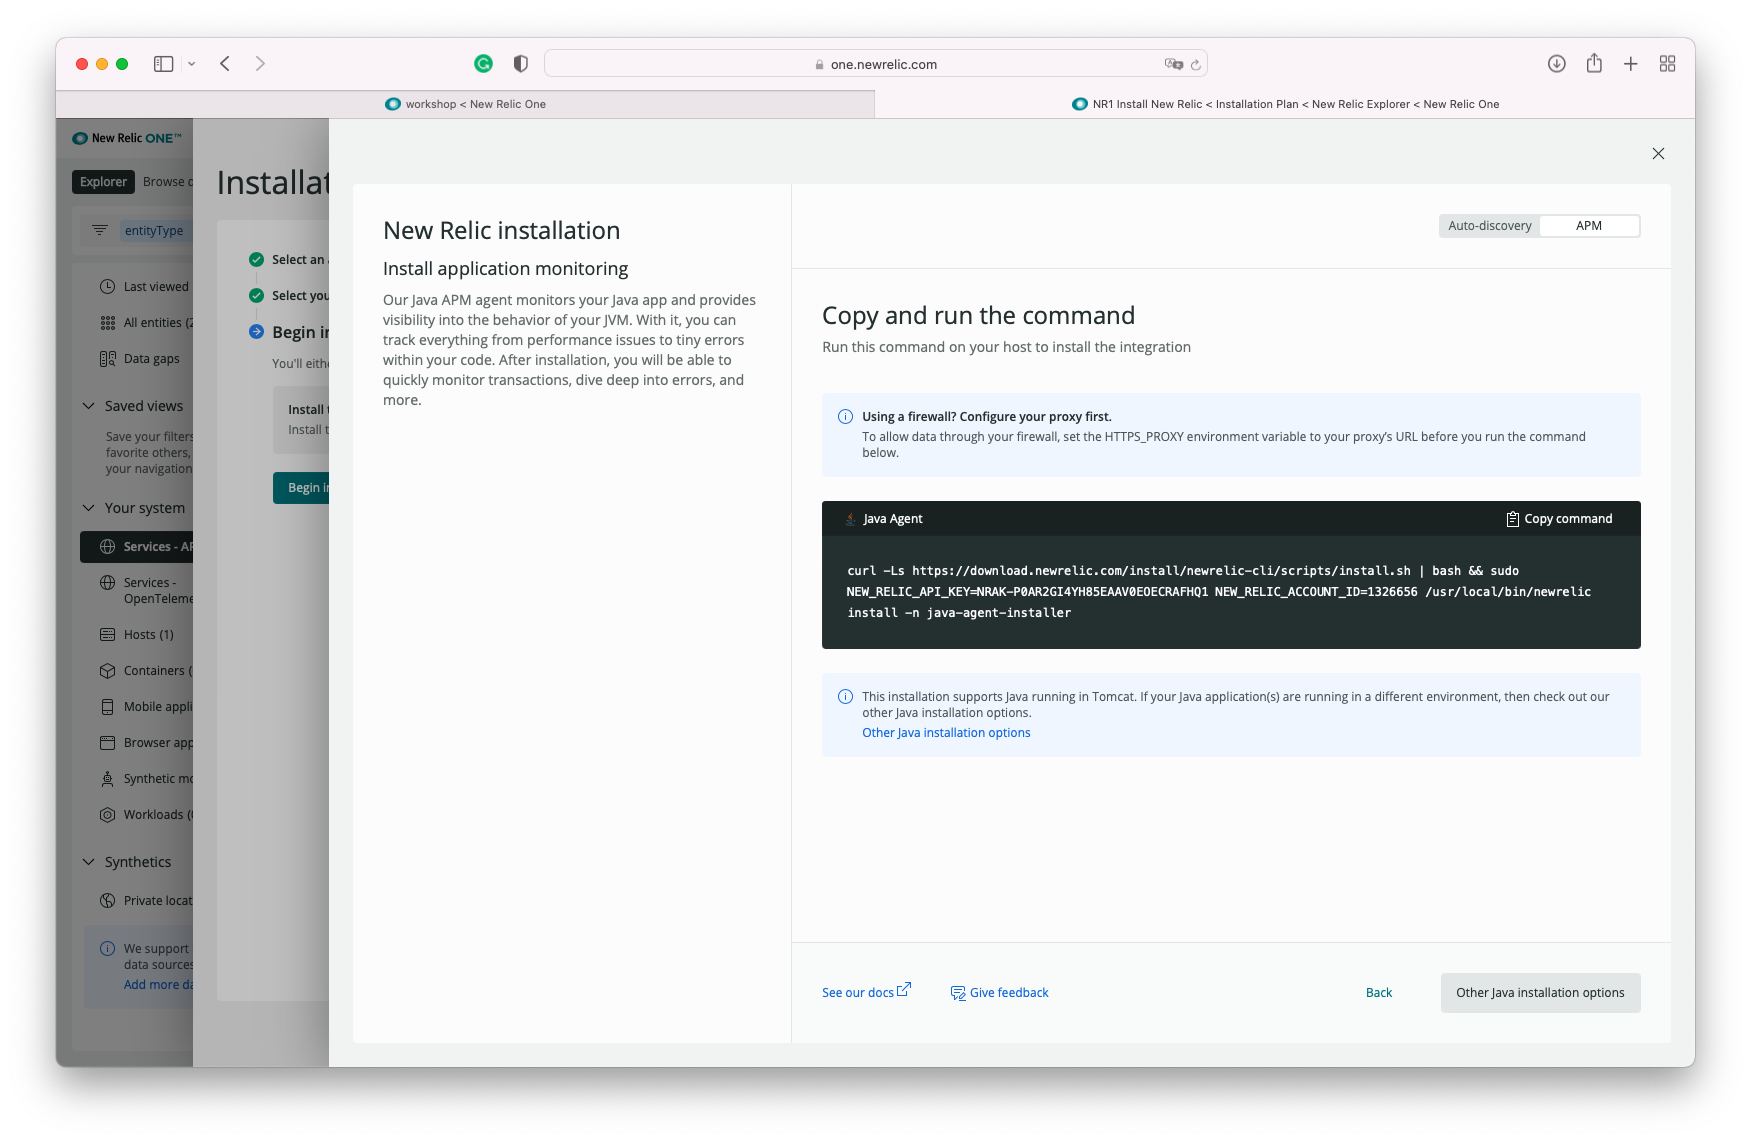
The wizard will output a few commands that need to be executed in the shell. Here's an example:
curl -Ls https://download.newrelic.com/install/newrelic-cli/scripts/install.sh | bash && sudo NEW_RELIC_API_KEY=<X12314125123123123123123> NEW_RELIC_ACCOUNT_ID=999999 /usr/local/bin/newrelic install
(DO NOT COPY AND PASTE this command during your exercise as it will not work. You should copy the command from your New Relic Install Wizard page. The command above has the API KEY and ACCOUNT NUMBER values REDACTED, and we need the actual values associated with your account)
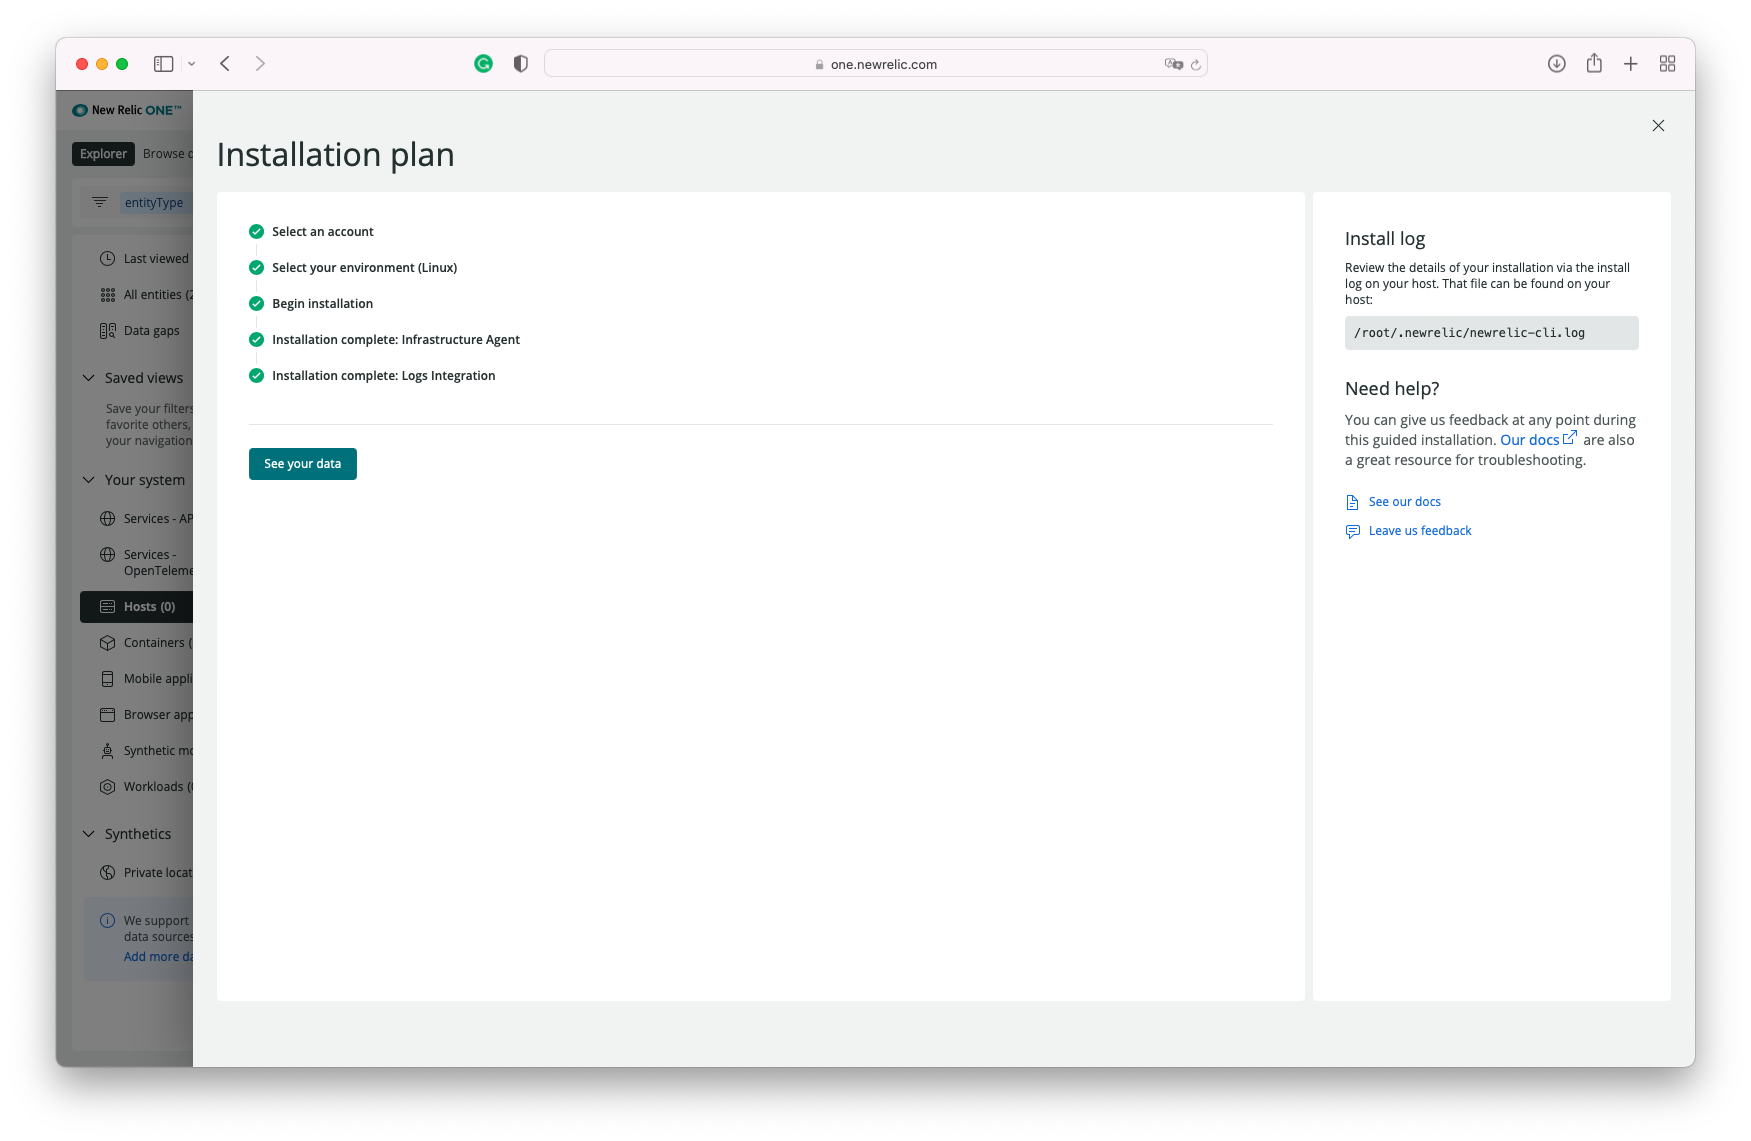
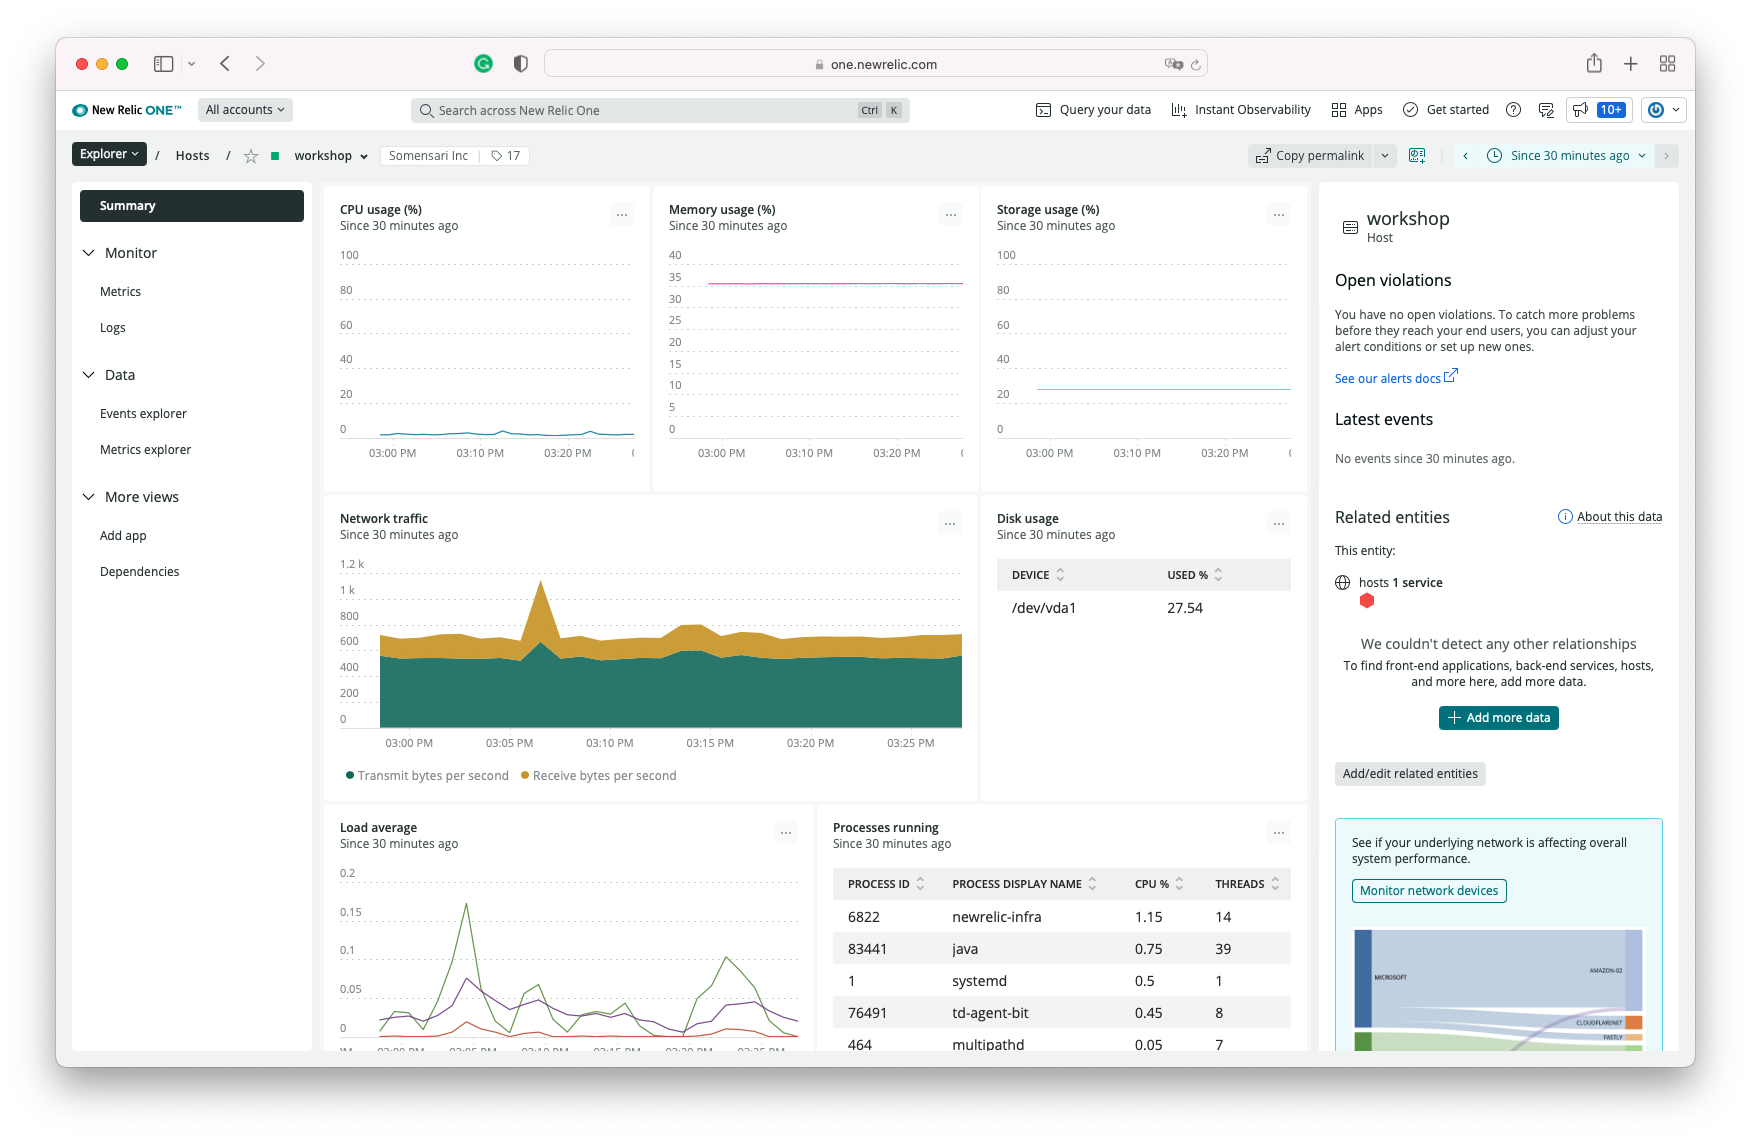
This command will download and set up the New Relic Infrastructure Agent. Once the installation is completed, you can navigate to the Infrastructure page to see the data from your host.
You can navigate and see your host information by cicking on Explorer >> Hosts >> Host Name (workshop)
Once you see data flowing for your host, we are then ready to get started with the Application setup
The first thing we need to set up APM is... well, an application. For this exercise, we will use the Spring Pet Clinic application. This is a very popular sample java application built with the Spring framework (Springboot).
We will now clone the application repository, then we will compile, build, package, and test the application.
git clone https://github.com/spring-projects/spring-petclinic
then we open the directory
cd spring-petclinic
and run the maven command to compile/build/package
./mvnw package -Dmaven.test.skip=true
(this might take a few minutes the first time you run, maven will download a lot of dependencies before it compiles the app. Future executions will be a lot shorter)
Once the compilation is complete, you can run the application with the following command:
java -jar target/spring-petclinic-*.jar
You can validate if the application is running by visiting.
http://<VM_IP_ADDRESS>:8080
(feel free to navigate and click around )
Now that the application is running, it is time to set up the APM instrumentation.
Let's continue the process by visiting the New Relic UI again.
Explorer >> Services - APM >> Add More Data
Select "Java"
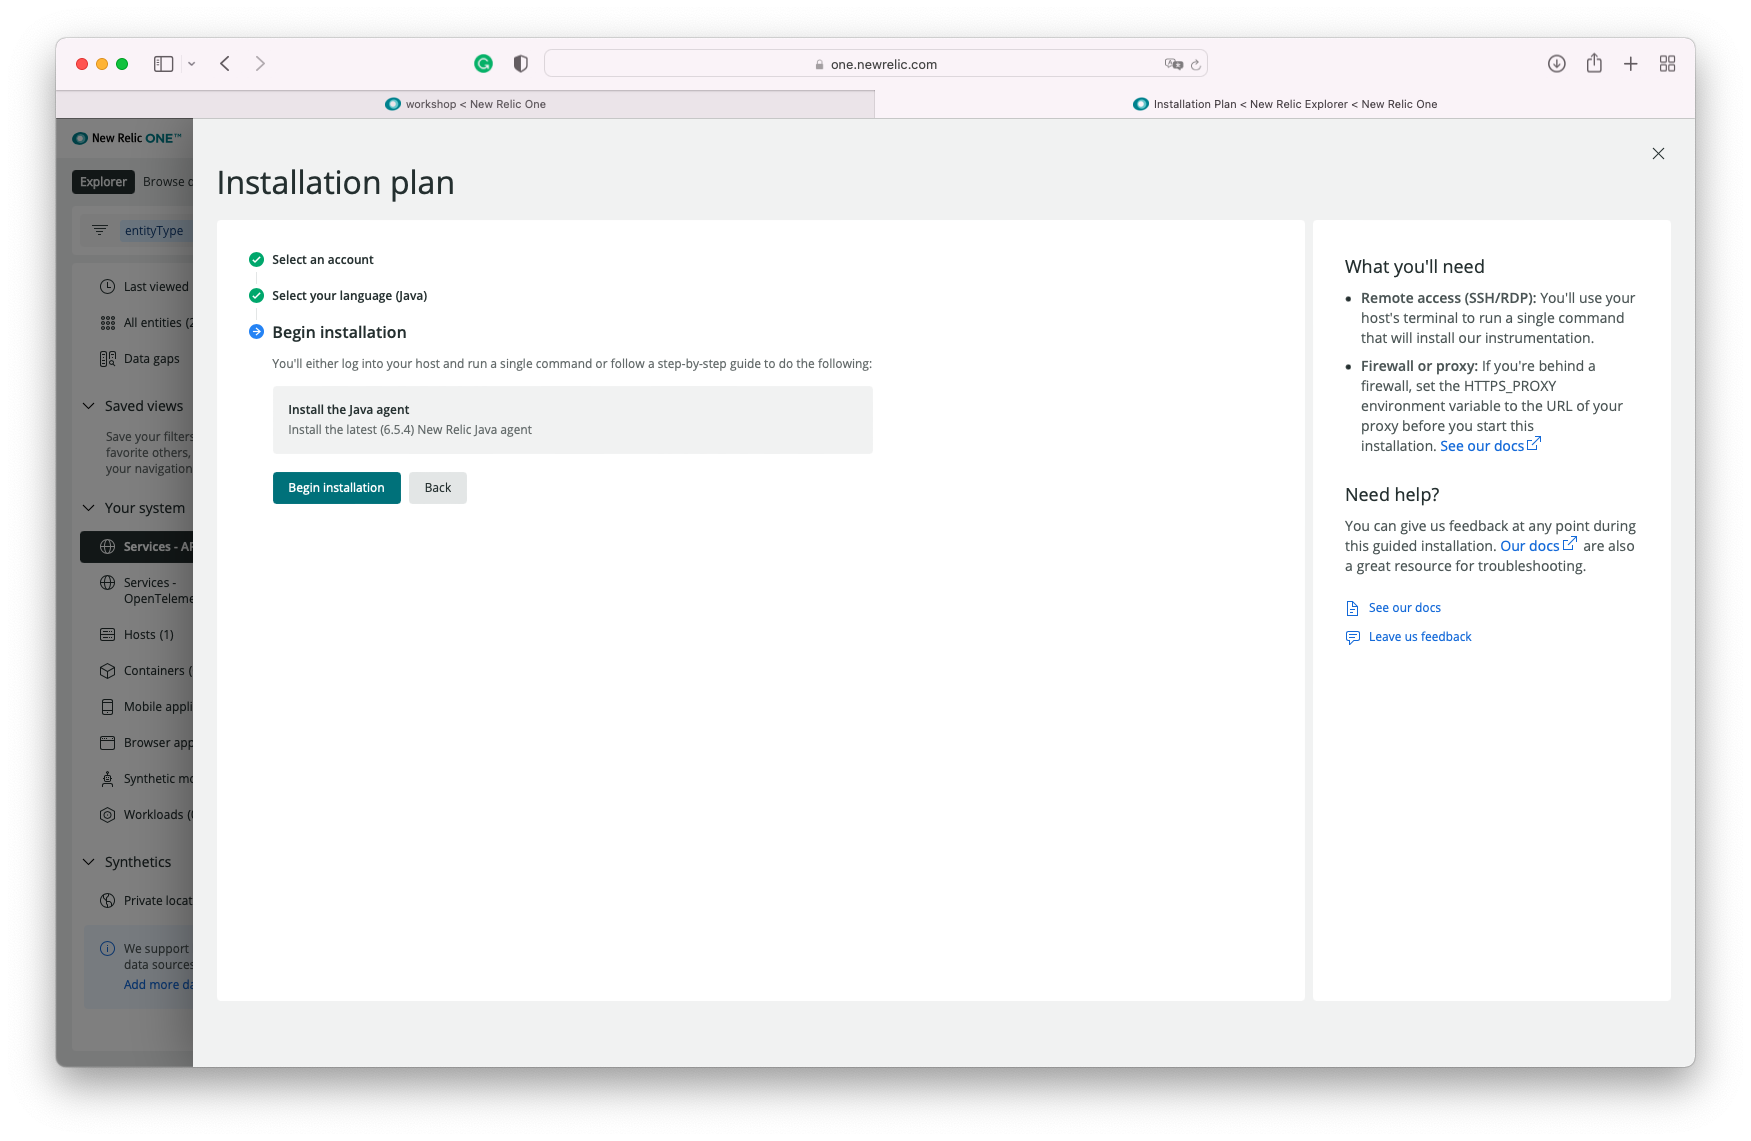
The wizard will guide you through the download of required files
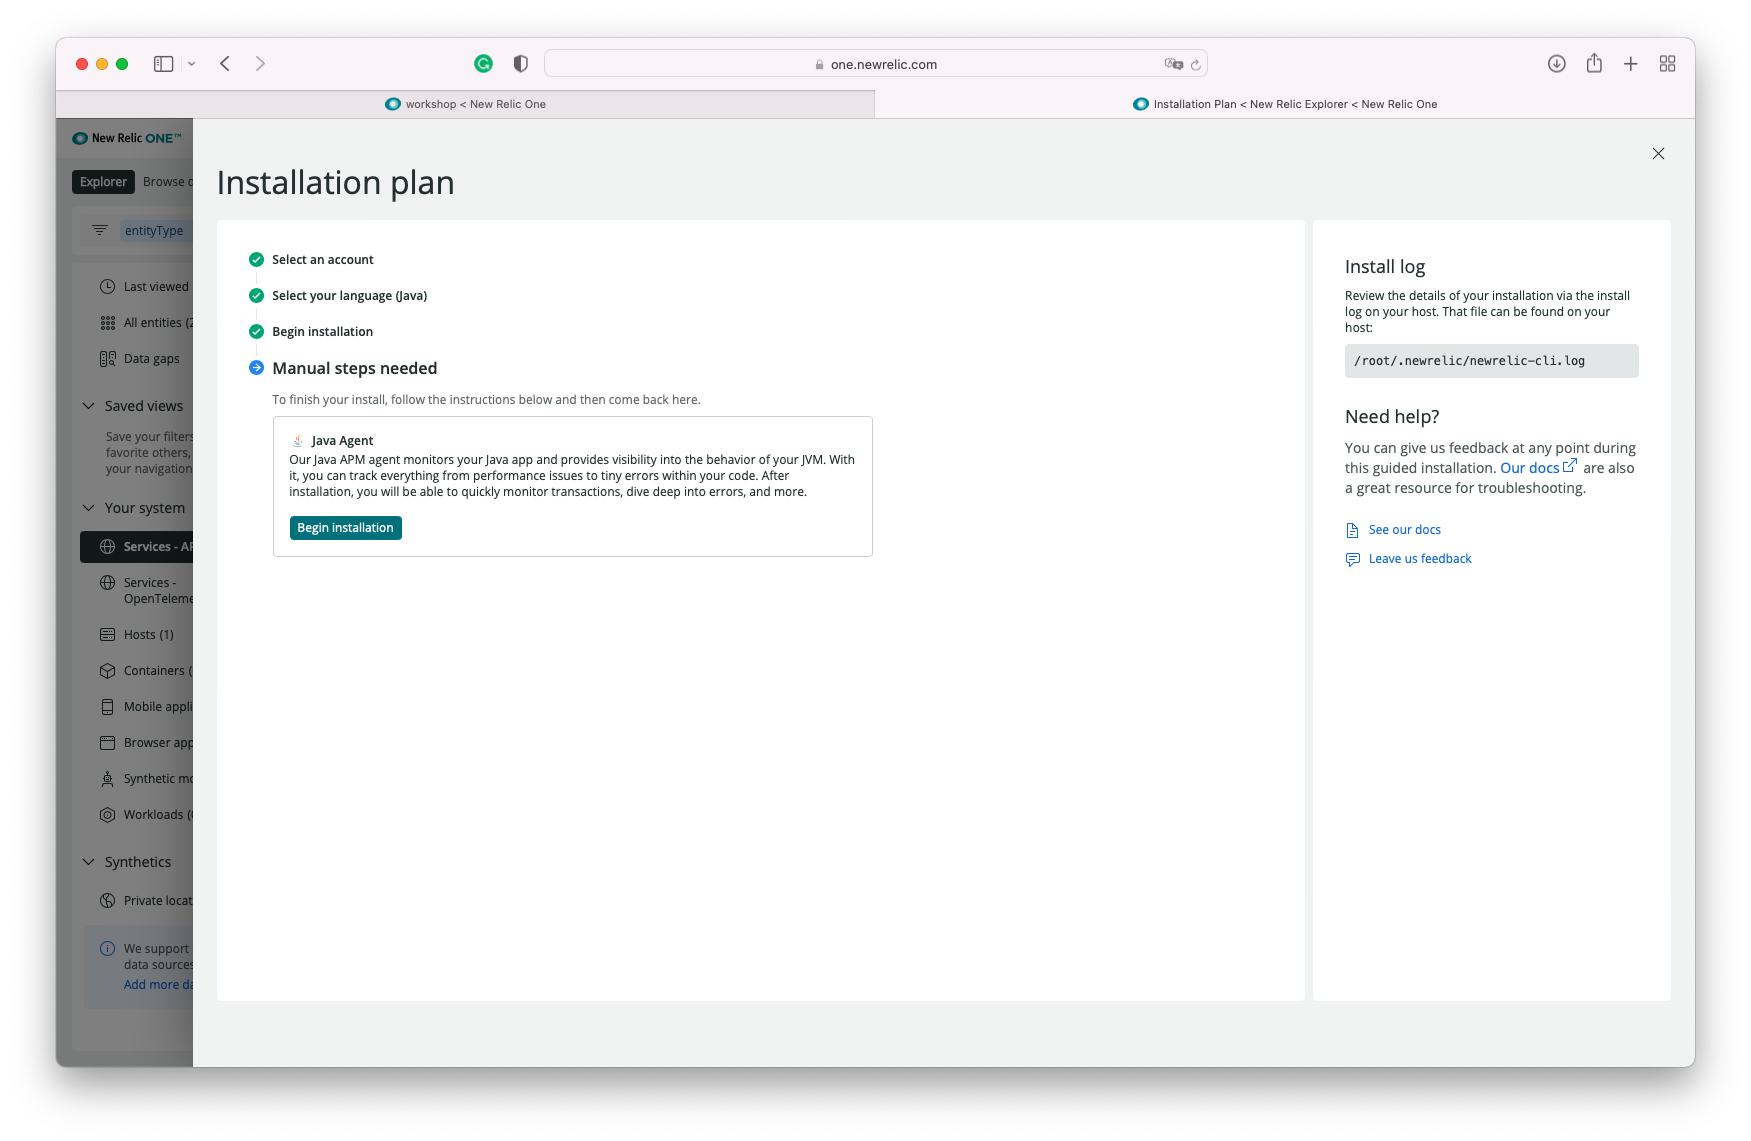
Java application monitoring setup requires manual download of the core files
The APM Instrumentation Wizard will show a few options for you to select, things like application name, environment, etc. In this scenario, we are using:
- Application Name: petclinic
- Environment: conf21
(make sure you are in the spring-petclinic directory)
cd ~/spring-petclinic
curl -O https://download.newrelic.com/newrelic/java-agent/newrelic-agent/current/newrelic-java.zip
unzip newrelic-java.zip
The agent is highly configurable and comes with most of the configuration already preset, but there are two mandatory properties we need to configure:
- Application Name
- License Key.
There are different ways to configure the New Relic APM Agent and the most popular ways are: YAML and Environment Properties. You can see more details here XXXX
You can configure the following environment properties and the agent will pick them up during startup.
export NEW_RELIC_APP_NAME=PetClinic
export NEW_RELIC_LICENSE_KEY=YYYY
Or
You can configure the newrelic.yml file and change the two properties there.
vim newrelic/newrelic.yml
and change the lines
license_key: YYYYYY
app_name: PetClinic
Lastly, we will run our application adding the -javaagent tag in front of the command
java -javaagent:./newrelic.jar -jar target/spring-petclinic-*-SNAPSHOT.jar
Let's go visit our application again to generate some traffic.
http://<VM_IP_ADDRESS>:8080
(click around, generate errors, add visits, etc )
Then you can visit the New Relic APM UI and examine the application components, traces, etc
IMAGE?
Explore >> Services >> APM?
For the End User instrumentation, we will add the New Relic Browser Javascript Agent (LINK?) snippet in the pages. We will use the wizard again.
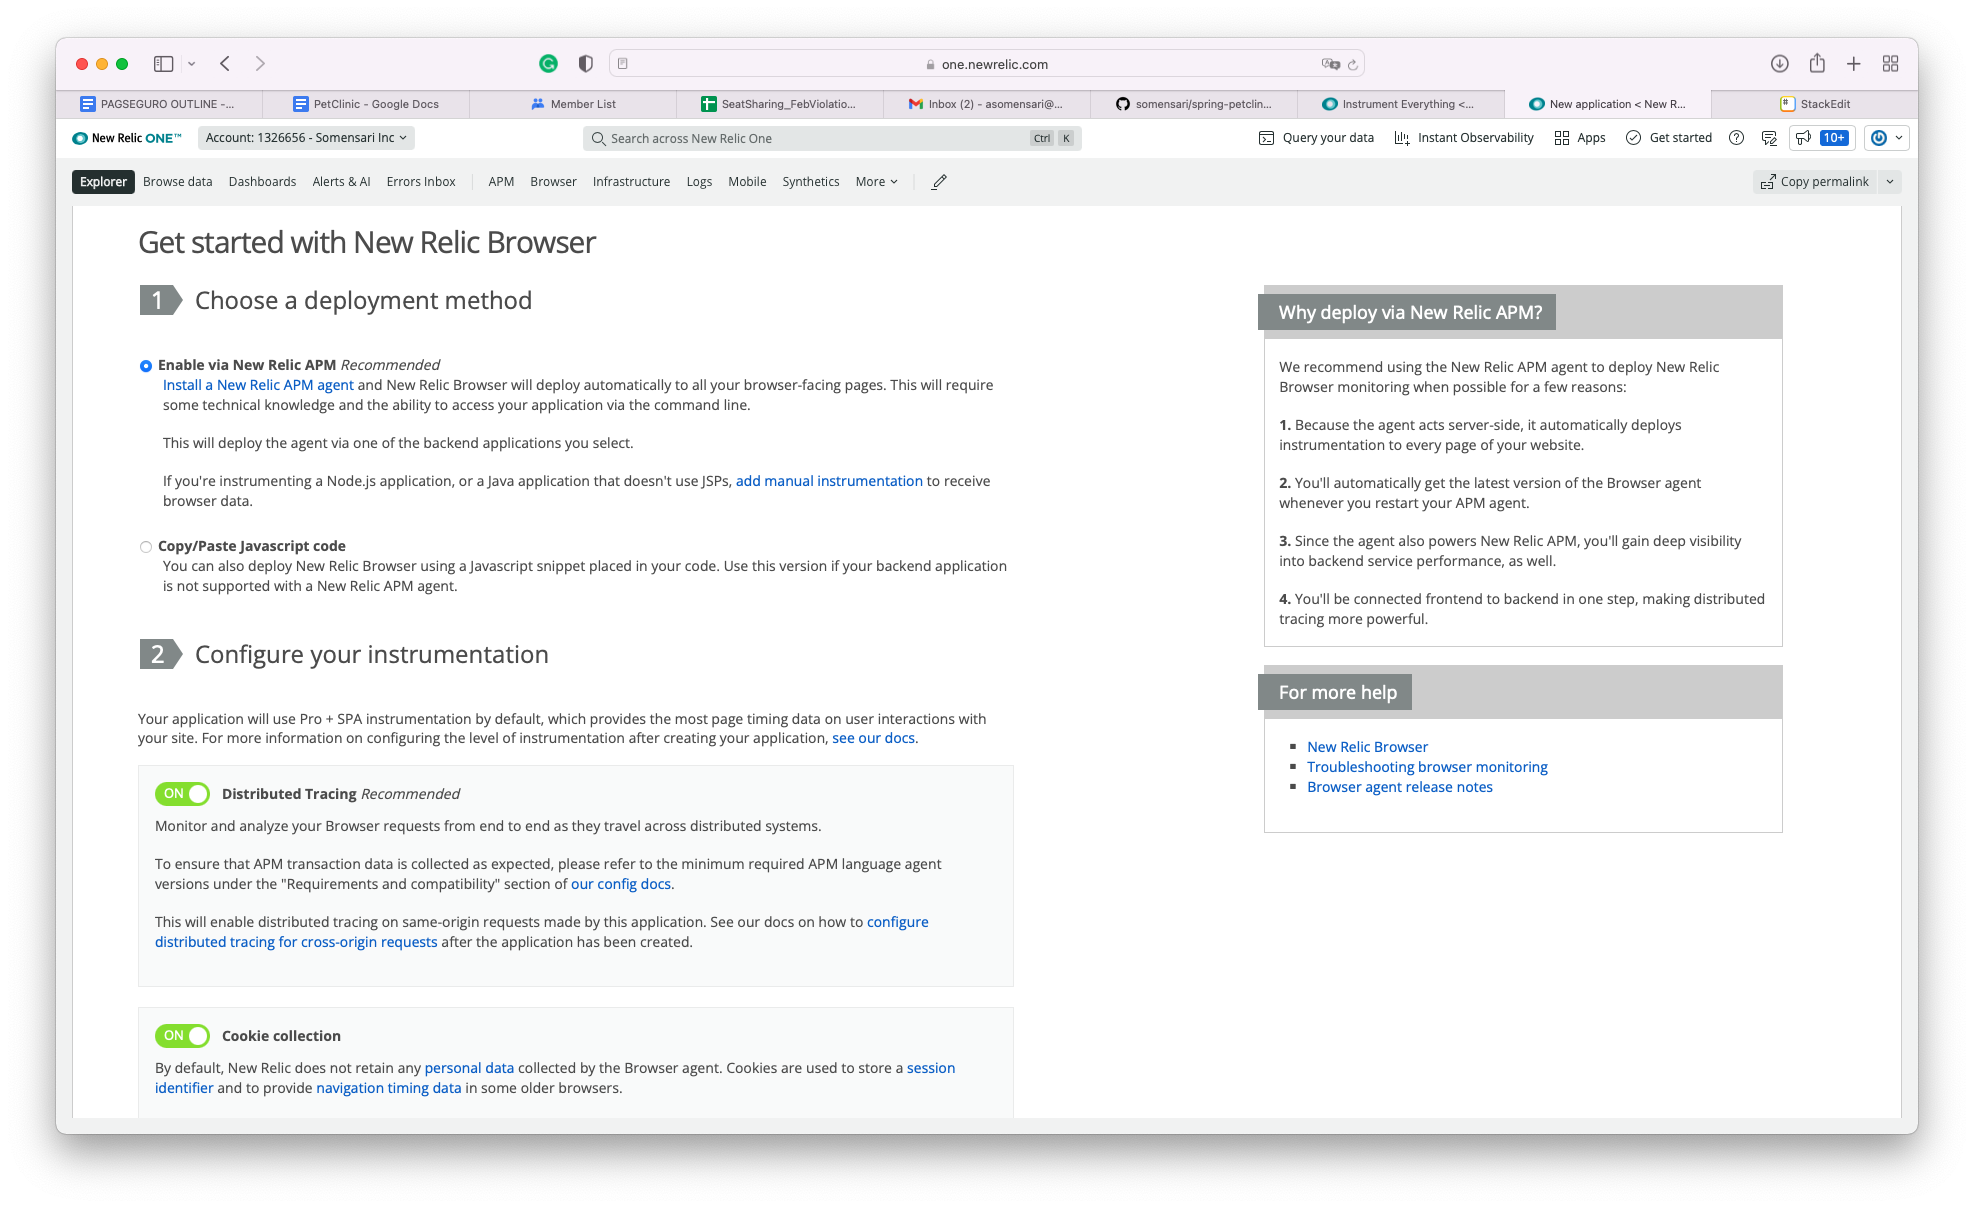
New Relic Browser offers two different options for the deployment method: Automatic Instrumentation Via APM and Copy-Paste
-
Automatic Instrumentation Via APM is the recommended approach where the APM Agent will instrument the pages by automatically injecting the javascript agent into the pages.
-
Copy and Paste is really what it means: You'll get a JS snippet that needs to be manually added to the pages.
The wizard will then show a snipped of HTML code that needs to be place at the top at the pages (preferably in the < HEAD > section).
You can keep the options on section 2 with default values (Distributed Tracing and Cookie Collection)
(IMAGE)
Last Step is to Name The application. Because we have the application already instrumented on APM, you should be able to "Search" and find the PetClinic in the list.
Once you click on "Enable", a JS Snippet will be displayed. Here's an example
**********???
The Spring PetClinic application uses a single HTML page as the "layout" page that is reused across all pages of the application. This is the perfect location to insert the New Relic Browser Agent Snippet as it will be loaded in all pages automatically.
Let's then edit the layout page:
vim src/main/resources/templates/fragments/layout.html
and let's insert the snipped we generated above in the < HEAD > section of the page.
Now we need to rebuild the application and run it again:
    ./mvnw package -Dmaven.test.skip=true
    java  -javaagent:./newrelic.jar -jar target/spring-petclinic-*-SNAPSHOT.jar
Then let's visit the application again to generate more traffic, now we should see RUM traces being reported.
http://<VM_IP_ADDRESS>:8080
(feel free to navigate and click around )
Let's visit the New Relic UI and see some of the traces and metrics.
Explore >> Browser
You should see some of the Spring PetClinic UI metrics showing up in the UI
For the New Relic Logs component, we will configure the Spring PetClinic application to write logs to a file in the filesystem and configure the New Relic Infrastructure agent to read (tail) that log file and report the information to the New Relic Platform.
The Spring PetClinic application can be configure to use a number of different java logging libraries. In this scenario, we are using logback. Let's create a logback configuration file:
We just need to create a file named logback.xml in the configuration folder.
vim src/main/resources/logback.xml
and add the following content:
    <configuration>
  <appender name="STDOUT" class="ch.qos.logback.core.ConsoleAppender">

    <!-- changed the encoder -->
    <encoder class="com.newrelic.logging.logback.NewRelicEncoder"/>

  </appender>

  <appender name="FILE" class="ch.qos.logback.core.FileAppender">
          <file>/tmp/spring-petclinic.log</file>
    <encoder class="com.newrelic.logging.logback.NewRelicEncoder"/>
  </appender>

  <root level="debug">
    <appender-ref ref="FILE" />
  </root>
</configuration>
After that, we need to rebuild the application and run it again:
    ./mvnw package -Dmaven.test.skip=true
    java  -javaagent:./newrelic.jar -jar target/spring-petclinic-*-SNAPSHOT.jar
Then let's visit the application again to generate more traffic, now we should see log messages being reported.
http://<VM_IP_ADDRESS>:8080
(feel free to navigate and click around )
We need to configure the New Relic Infrastructure Agent to tail the Spring Pet Clinic log file and report the data to the New Relic endpoint.
The logging configuration files can be found /etc/newrelic-infra/logging.d/, with a few examples
So we need to create an yaml file
sudo vim /etc/newrelic-infra/logging.d/petclinic.yaml
and add the following lines:
logs:
  - name: petclinic-log
    file: /tmp/spring-petclinic.log
And paste the contents from the snippet above.
Then visit: Explore > Logs
(IMAGE)
And you can add a filter to select only log messages from your host and the Spring PetClinic Application:
Fields **** hostname **** **** AppService ****
Add Filter > Fields > service.name > your application name
This the end of the exercise and we certainly covered a lot of ground. At this point you should have metrics, traces and logs being reported into your New Relic account.
