-
Notifications
You must be signed in to change notification settings - Fork 806
Debugging Stack Traces from Crash Dumps
On windows, you can configure your system to automatically collect crash dumps of your applications and use Visual Studio or WinDBG to debug them.
Windows Error Reporting (WER) can be configured to collect full dumps from application crashes, and store them locally on your machine. Since this feature is not enabled by default, its activation requires administrator privileges. Follow the steps below to configure it.
- Open the Registry Editor by typing “regedit” (1) in the Start Menu and pressing Enter.

- Navigate to the Windows Error Reporting (1) key under HKEY_LOCAL_MACHINE\SOFTWARE\Microsoft\Windows\Windows Error Reporting.

- If it’s not present already, add the LocalDumps key by right-clicking (1) on the Windows Error Reporting key and selecting New (2) > Key (3).

- Name the key LocalDumps (1) and press Enter.

- Following the same steps, create another new key for your application under the LocalDumps key. For example, HKEY_LOCAL_MACHINE\Software\Microsoft\Windows\Windows Error Reporting\LocalDumps\MyApplication.exe (1).
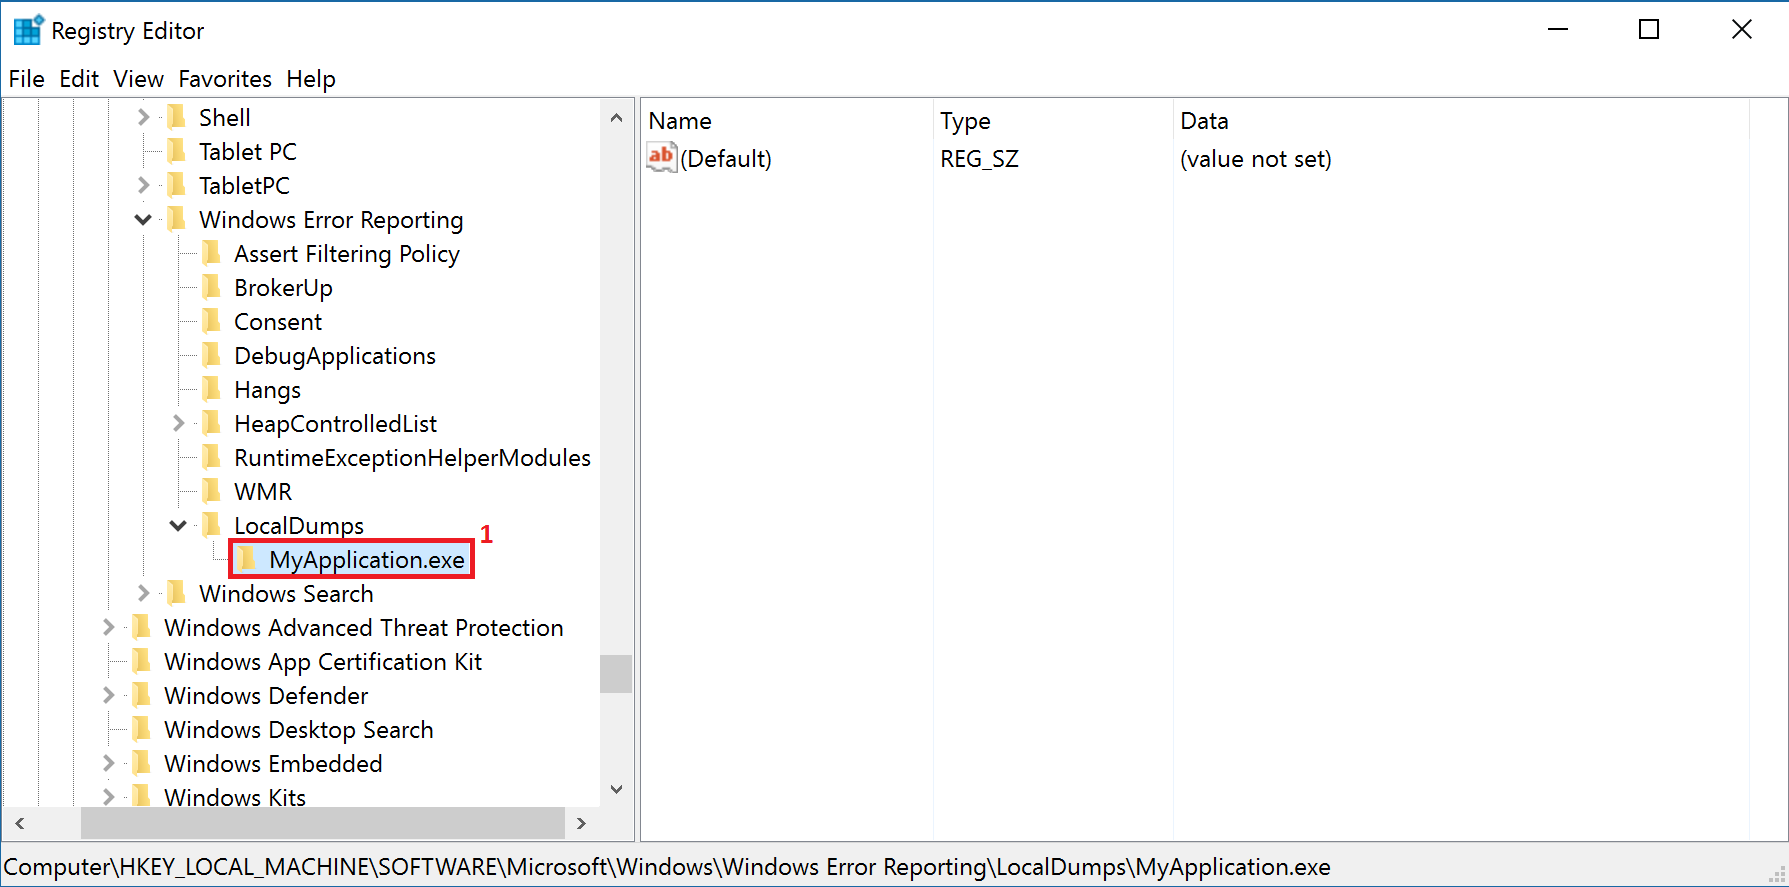
- Under the MyApplication.exe key, add the values on the table below by right-clicking on the right pane of the Registry Editor and selecting New (1) followed by the corresponding value type (2).
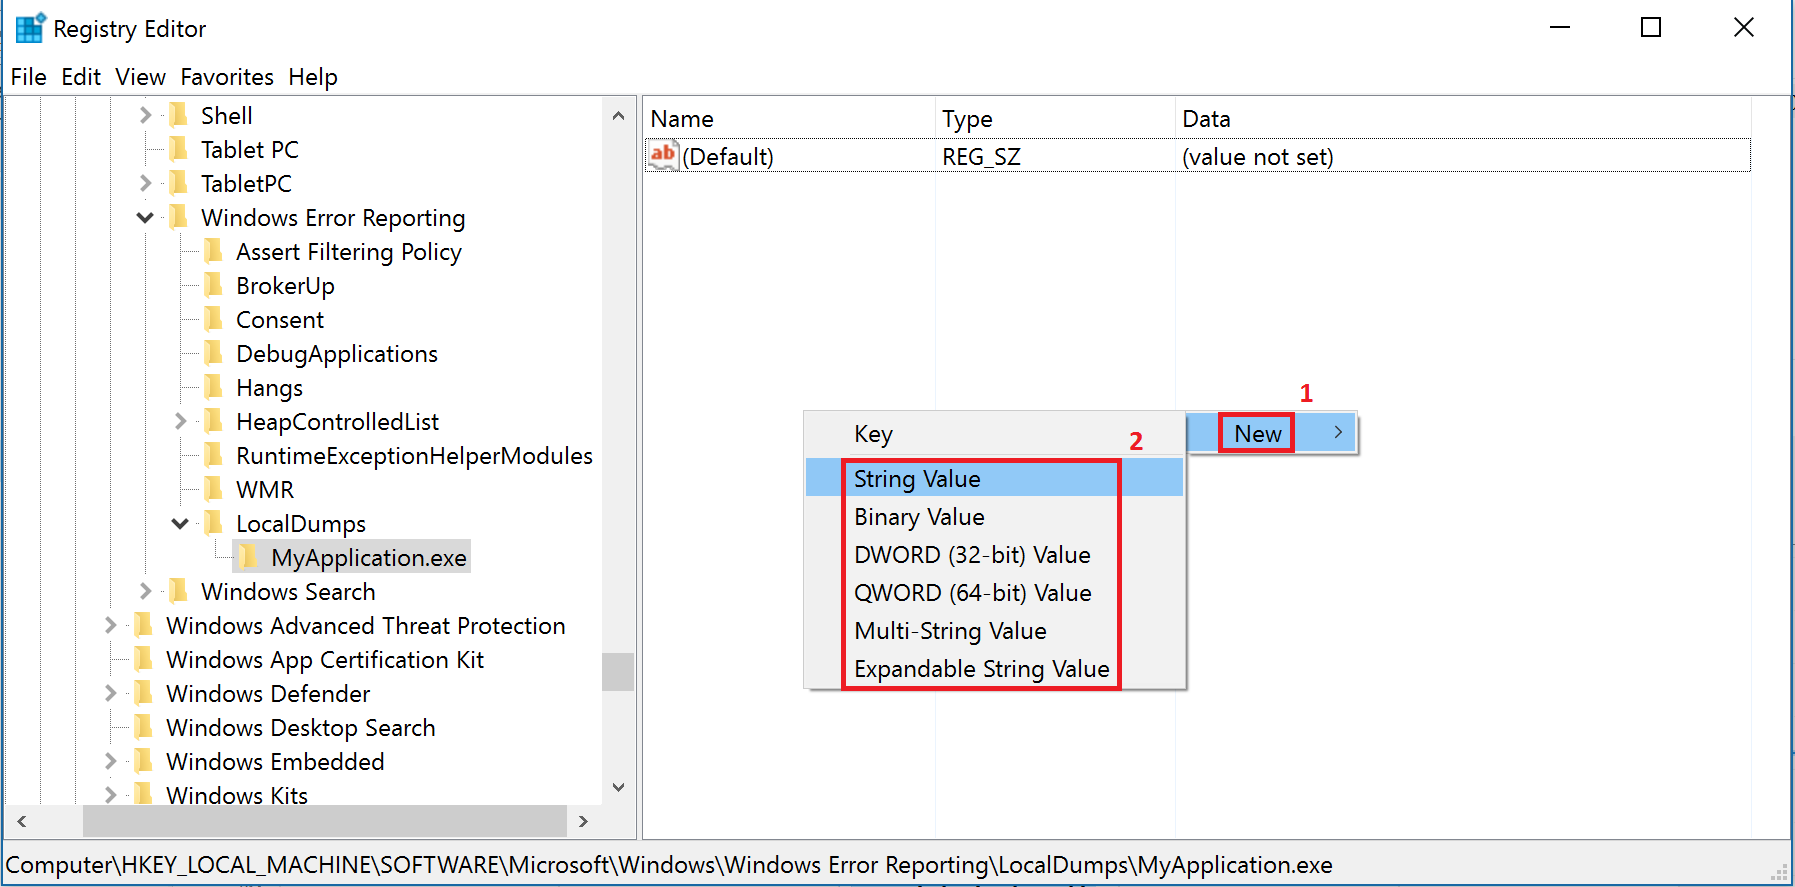
Table 1: Registry Values for Collecting Crash Dumps
| Value | Description | Type | Value Data |
|---|---|---|---|
| DumpFolder | The path where the dump files are going to be stored. | Expandable String Value (REG_EXPAND_SZ) | %LOCALAPPDATA%\CrashDumps |
| DumpCount | The maximum number of dump files in the folder. When the maximum value is exceeded, the oldest dump file in the folder will be replaced with the new dump file. | DWORD (32-bit) Value (REG_DWORD) | 10 |
| DumpType | 0: Custom dump 1: Mini dump 2: Full dump |
DWORD (32-bit) Value (REG_DWORD) | 2 |
| CustomDumpFlags | The custom dump options to be used. This value is used only when DumpType is set to 0. | DWORD (32-bit) Value (REG_DWORD) | 0 |
- Once you have created the above values, right-click (1) on them and select Modify (2) to set their value data, still according to the table of the previous step.

- Enter the corresponding value data (1) for each value, selecting its Base (2) if necessary, and click OK (3).

Once you’re done, you should have the keys and values below:

Your system should now collect crash dumps for your application whenever it crashes. For more information on the process above, check the Windows Dev Center Collecting User-Mode Dumps documentation.
To properly generate and debug the crash dump files, your application executable name must not contain any spaces. To change your executable name:
- Right-click on your project (1) in Visual Studio and select Properties (2).

- In the Properties Window, select General (1) under Configuration Properties (2) in the left menu and change the Target Name (3) field, which corresponds to your executable name.

If you changed your executable name, don’t forget to rebuild your app with the new settings.
For the crash dump files to be fully generated, your project Debug Information option must be enabled.
- Right-click on your project (1) in Visual Studio and select Properties (2).

- In the Properties Window, select General (1) under Clang (2) in the left menu and change the Debug Information field to “Yes (-g)” (3) if it’s not already enabled.

If you changed the Debug Information field, don’t forget to rebuild your app with the new settings.
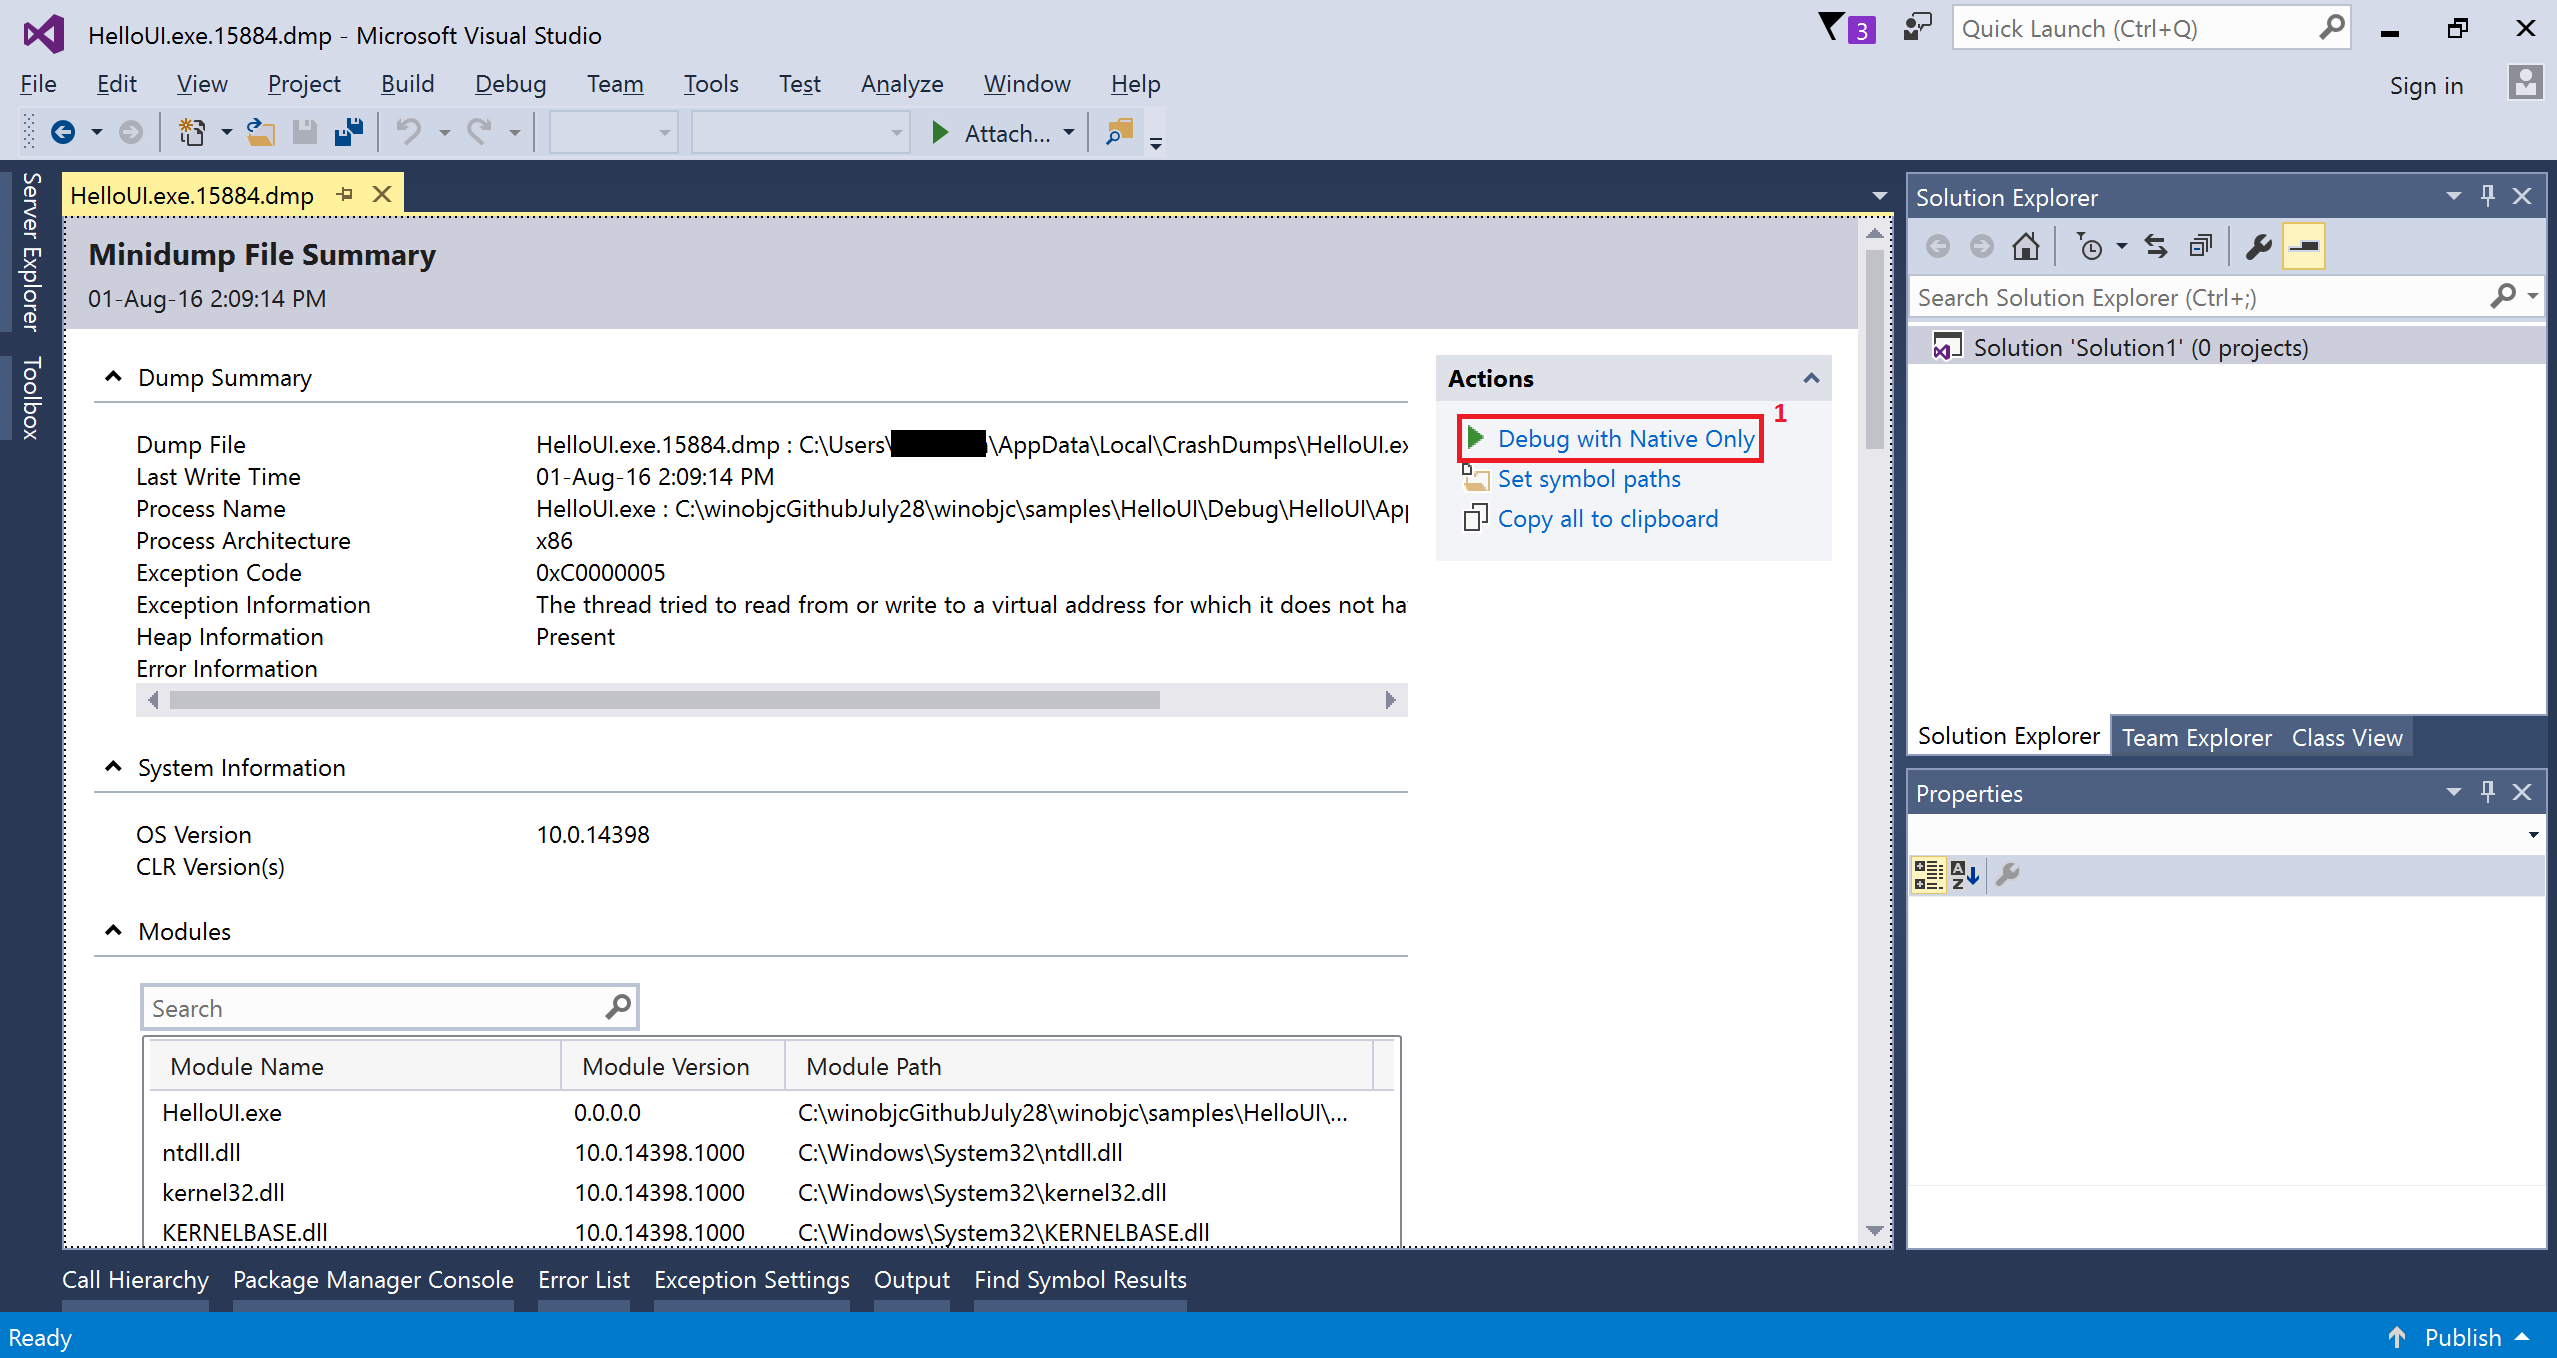
You can open a crash dump in Visual Studio to debug it.
- Open Visual Studio.
- Drag and drop your crash dump (.dmp) file into Visual Studio to open it. It should be under %LOCALAPPDATA%\CrashDumps, where %LOCALAPPDATA% usually corresponds to C:\Users\user\AppData\Local.

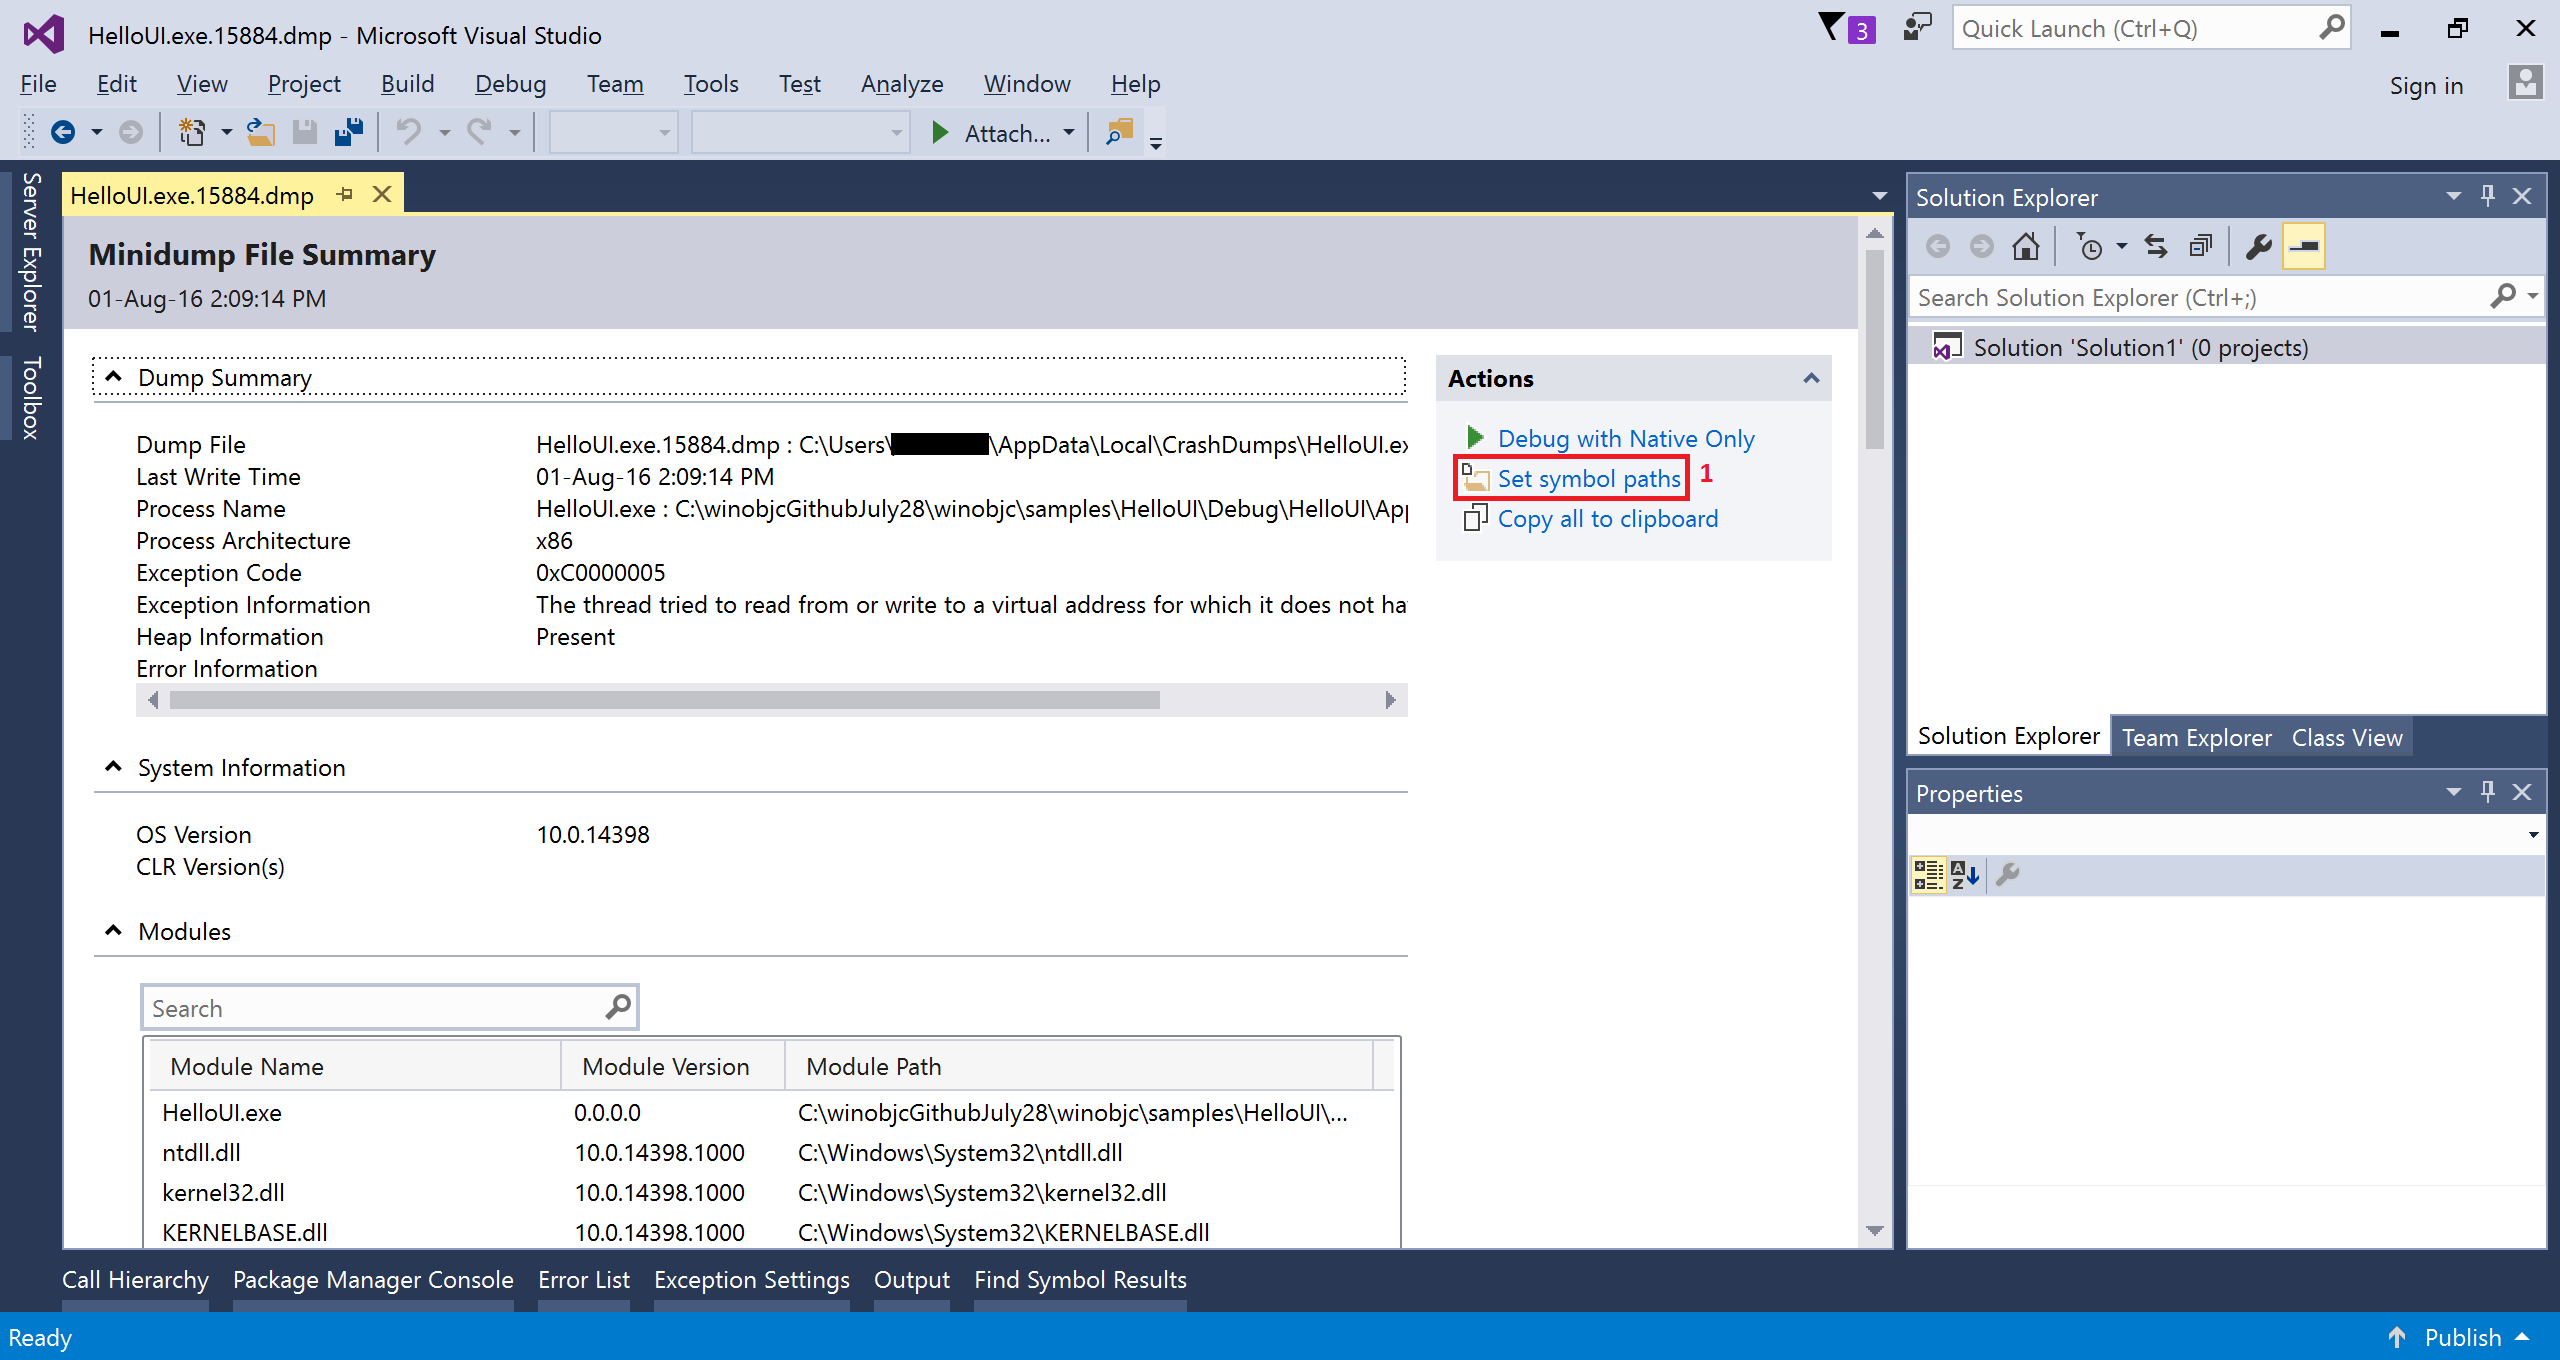
- Click on Set symbol paths (1).
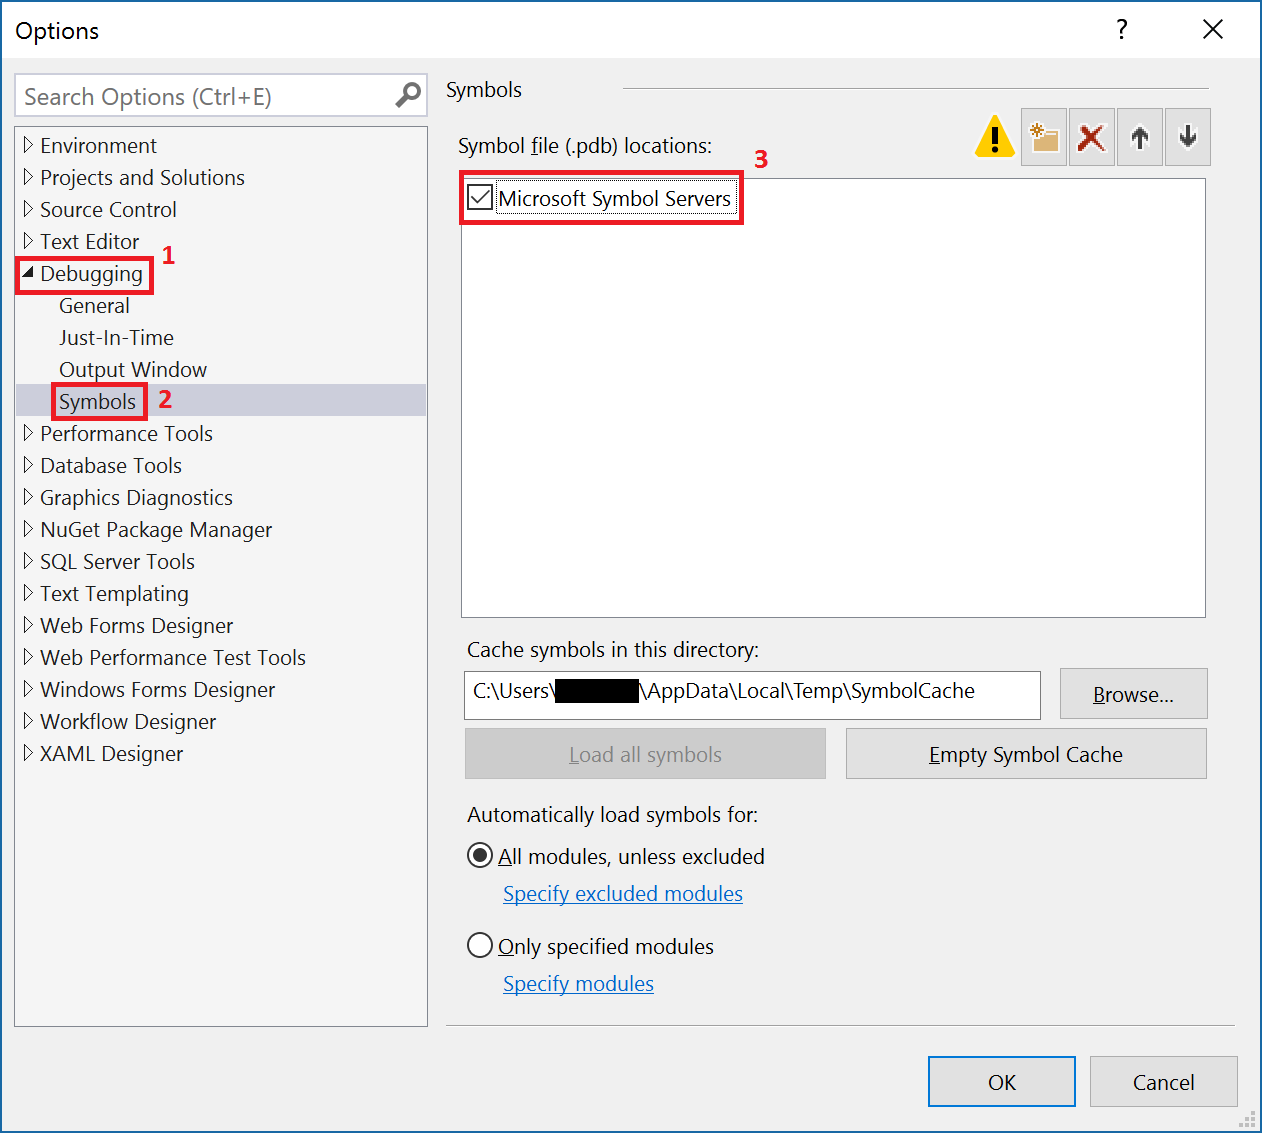
- Under Debugging (1) > Symbols (2), check the Microsoft Symbol Servers (3).
- Click on the new symbol file location button (1), and add the path to your application symbols (2). If you created your app under the samples folder of the SDK, your path would be c:\winobjc\samples\MyApplication\Debug\MyApplication. Then, click OK (3).

- Click on Debug with Native Only (1) to start debugging the crash dump.
- When an exception is thrown, Visual Studio will give you a warning. Click Break (1) to start debugging.

- When execution stops, you’ll be able to see variables in the Locals window (1), the assembly code in the Disassembly window (2) and the call stack in the Call Stack window (3). When possible, Visual Studio will also open the source file that originated the function calls on the stack when you double-click on them in the call stack window. You’ll see a marker (4) where execution is currently stopped.

- You can now debug your crash dump with the usual Visual Studio debugging functionalities. For more information, check out the Debugging in Visual Studio documentation on the Microsoft Developer Network.
If you prefer, you can also use WinDbg to debug a crash dump. It’s a debugger that is part of the Windows Debugging Tools, which you can download using the Get Debugging Tools for Windows (WinDbg) (from the SDK) link, under the “Get debugging tools” section of the Download the WDK, WinDbg, and associated tools page from the Hardware Dev Center.
- Open Windbg by typing “windbg” (1) in the Start menu and pressing Enter.

- Drag and drop your crash dump (.dmp) file into the WinDbg window to open it. It should be under %LOCALAPPDATA%\CrashDumps, where %LOCALAPPDATA% usually corresponds to C:\Users\user\AppData\Local.

- Set your application executable file search path by entering the .exepath+ (1) command followed by the path to your application executable. If you created your app under the samples folder of the SDK, your path would be c:\winobjc\samples\MyApplication\Debug\MyApplication.

- Add the Microsoft public symbol server to your symbol path by entering the .sympathy+ srv*https://msdl.microsoft.com/download/symbols (1) command.

- Add your application symbols to your symbol path by entering the .sympathy+ (1) command followed by the path to your application symbols. If you created your app under the samples folder of the SDK, your path would be c:\winobjc\samples\MyApplication\Debug\MyApplication.

- Set the exception context by entering the .ecxr (1) command, allowing the stack walk to work properly. Note that, when possible, WinDbg will automatically open the source file and point to the code line that originated the exception (2).

- Display the stack frame by entering the k (1) command.

- You should now be able to explore your crash dump stack frame. Try out the !analyze -v command, which displays information about the current exception or bug check, or check out the Debugger Reference on the Hardware Dev Center for more commands.
Want a deeper dive into what the debugging tools for Windows can do? Check out:
- The Crash dump analysis using the Windows debuggers (WinDbg) documentation for more information on debugging crash dumps with WinDbg.
- The Debugging a UWP app using WinDbg documentation to learn how to debug a running UWP with WinDbg.
- The Debugging Tools for Windows documentation for an overview of all the tools available.
- The Debugger Operation documentation for details on how to use the different debugging tools for Windows.
- The Debugging Techniques documentation for information on standard and specialized debugging techniques for Windows.
- Having a space in your application executable name will prevent you from generating and debugging crash dumps properly. To rename your application executable, check Removing Spaces section of this page.
- Updating your Operating system may reset the registry keys enabling the collection of crash dumps. If so, re-create the registry keys according to the Collecting Crash Dumps section of this page.
- When using WinDbg, you might receive errors stating that some symbols files could not be found, even after setting the symbol paths for your application and the Microsoft public symbol servers. That’s because some symbols are internal to Microsoft and are not publicly available.
Project
Using the bridge
- Getting Started
- Using vsimporter
- Using the SDK
- Building From Source
- Adding Objective C to an Existing Project
- UI Guidance
- Changing the SDK Version of a Project
- Debugging
- Debugging Stack Traces from Crash Dumps
- Supported Third Party Libraries
- Creating and Linking Against C++ Static Libraries
- Packaging
Samples and Tutorials
- Quick Start Tutorial
- Building a To-Do List App
- Building a Calculator App
- Mixing and Matching UIKit and XAML
- IOS Bridge Samples Repo
Contributing
Links