Click Here to View Tableau Story
CitiBike, a bikesharing platform, is a popular mode of transportation for New Yorkers. We had an idea to start our own bikesharing platform in Des Moines and in order to gain funding from an angel investor, we must set out and create a Tableau analysis report for CitiBike. We can then apply their best practices onto our proposed bikesharing platform for Des Moines. We dive into the month of August 2019 to perform our initial analysis.
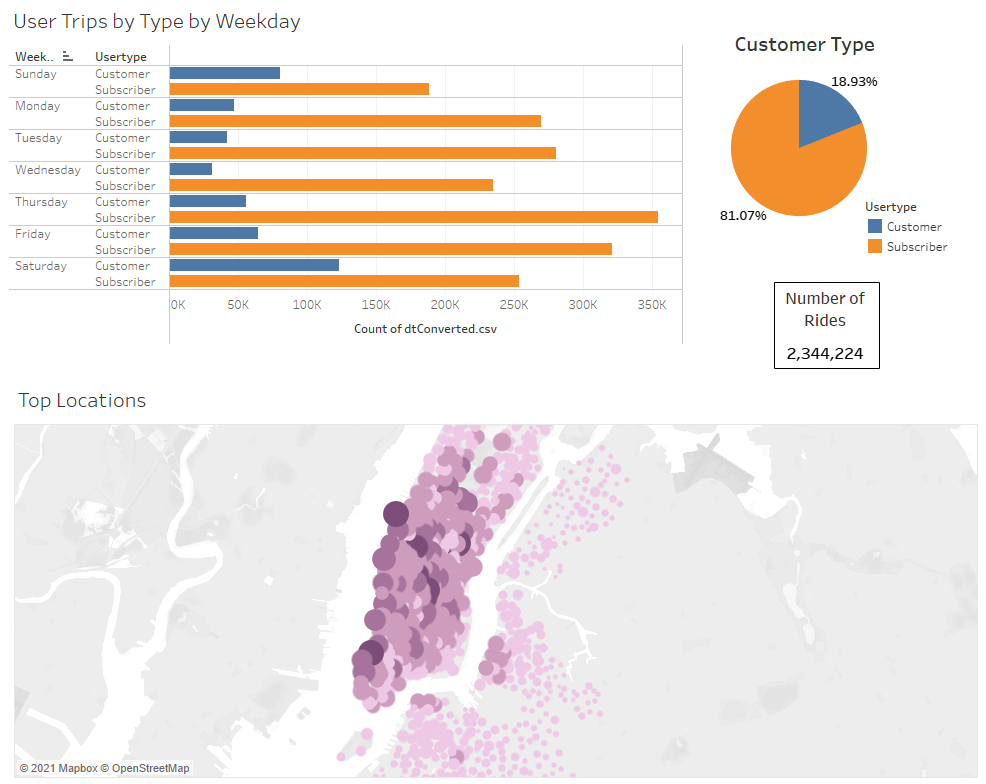
According to its publicly published data, Citibike is being used heavily in business districs & high tourist traffic areas, namely Midtown & Lower Manhattan. As we go outwards of the heart of Manhattan, users trend downwards. The bikesharing platform's revenue is also heavily reliant on its Subscribers which may mean that more than half of its users are actually New Yorkers, using CitiBike for commute between places. One-time cyclists would more likely be the tourists using the bikesharing platform to explore the city.
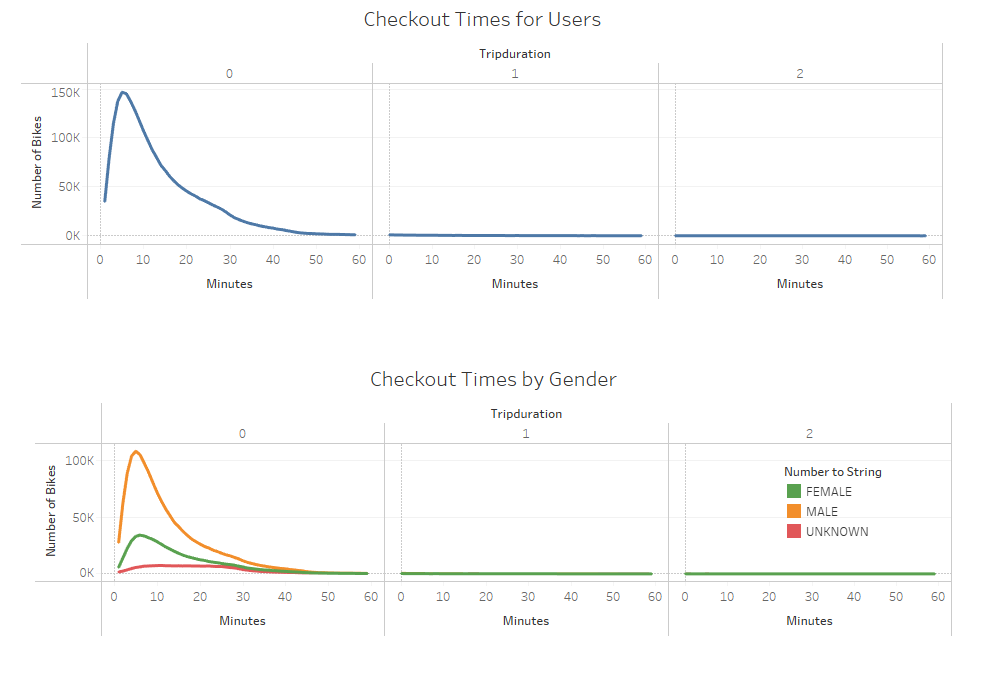
In this section, we have a snapshot of usage durations of all rides taken in August 2019. Checkout times peak at around 10 minutes and trend downwards until 40 minutes. We also separated checkout times between genders to see a summary of our users. Based on the data we can see that male users utilize the bikesharing platform the most vs. others. It is also highly recommended to create stations 10-15 minutes apart from each other to maximize the proposed platform's revenue.
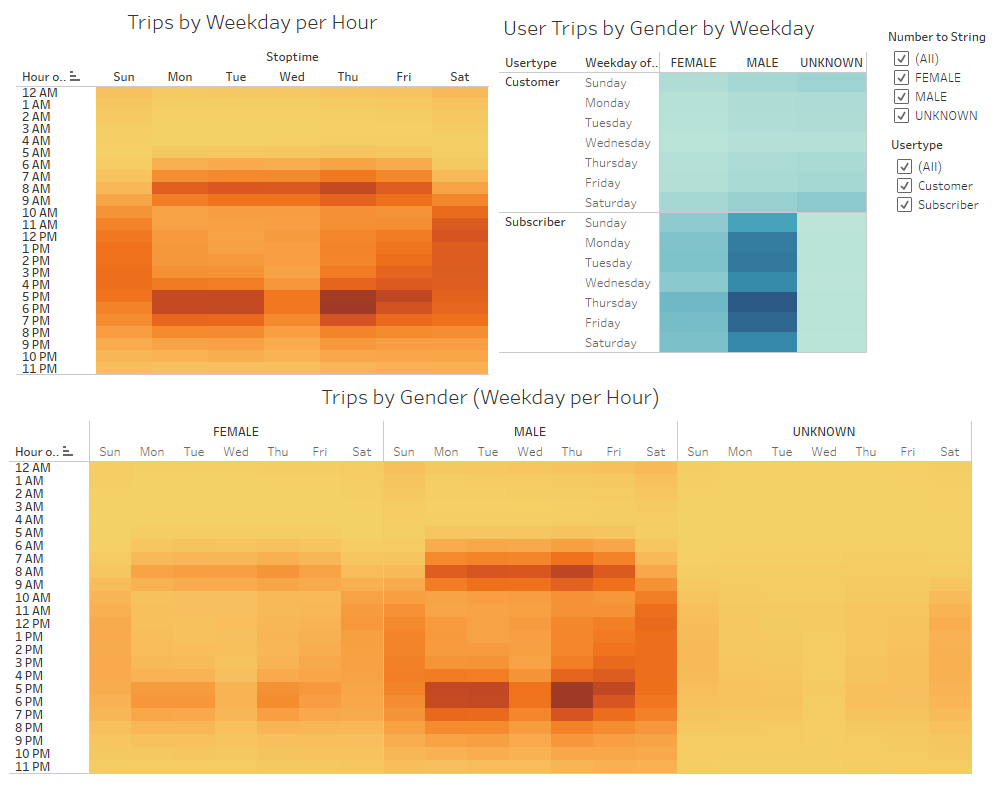
We then separated each bike usage and sectioned them into the different days of the week. All throughout the week, usage starts at around 7AM and end at 8-9PM. Darker colored areas mean more bikes are getting checked out and peak hours are at 8AM & 6PM. This further supports that the platform is being utilized more for commute by New Yorkers on weekdays. On weekends, it is spread more throughout the whole day rather than going into or out of work. We also separated usages between genders to further support our claim that males use the platform more than the others.
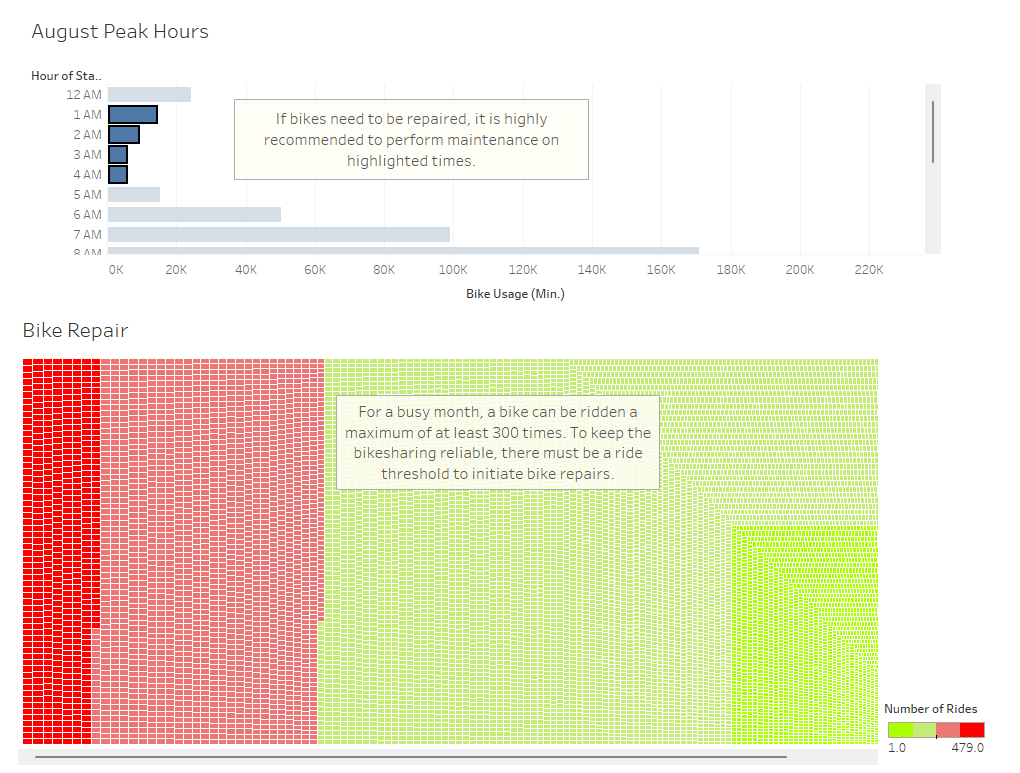
With usage comes wear & tear, if we are to propose a bikesharing platform to an investor, maintenance will be a key part of the presentation. We sectioned each usage between hours and deduced that lowest usage hours are between 1AM - 4AM. Within a month, a bike can be ridden up to 300 times and it is highly recommended to perform repairs & maintenance to these bikes. It is highly recommended to do these tasks at said hours to keep the bikesharing platform competitive.
To further help our business plan, it is recommended to create more visulizations for future analysis:
- Creating multiple overlays for a month by month analysis of all visualization & and yearly overview of any given dataset
- Inserting weather data patters, if it heavily affects the bikesharing platform


