This repository contains a suite of tools for reporting and machine learning workflow from LifeScope data. Reporting is focused on building approachable dashboard visualizations and infographics.
Machine learning models based on LifeScope data are currently focused on behavior modeling, correlation, prediction, suggestion, and impersonation.
https://jupyter.org/install.html
LifeScope-AI-Detectron2.ipynb https://colab.research.google.com/drive/1WTbZ4P4fEVlcnvDatiPlUiRXH5A8p-bq
LifeScope-AI-Tacotron2.ipynb https://colab.research.google.com/drive/1jj_VdwWwHEJRjxbYTmX9S7uzDgmi3txZ
LifeScope-AI-DialoGPT.ipynb https://colab.research.google.com/drive/1K-UK2h13yEzQFI7L4mz9amr9i4xaegF0
- Persona-based model. Condition responses on a certain author of messages (User ID) to make responses lexically similar to them and mimic someone’s linguistic style in a conversation. Use new or pre-trained models to run a chatbot that maintains a conversation in a certain emotional state.
- Emotional chatting machine with your own set of emotions. There are so many emotions that you can use as condition labels in your dataset. CakeChat only uses five basic emotions (anger, sadness, joy, fear and neutral).
- Topic-centric model. Instead of emotions, you can use a set of topics that will condition the model’s responses. As a result, you can build an agent that sticks to a given topic in a conversation. For example, you can build a model that talks about weather, food, kids or mortgage at any given moment.
Geospatial Anomaly Map Example
Prediction and anomaly detection based on location history.
(Tensorflow)
(concept phase, low priority)
- MVP: Infographic reports individuals can run on demand.
- Weekly email of reports.
- Custom reporting.
- Reporting on groups.
Create infographics and reports for LIFESCOPE users based on their data.
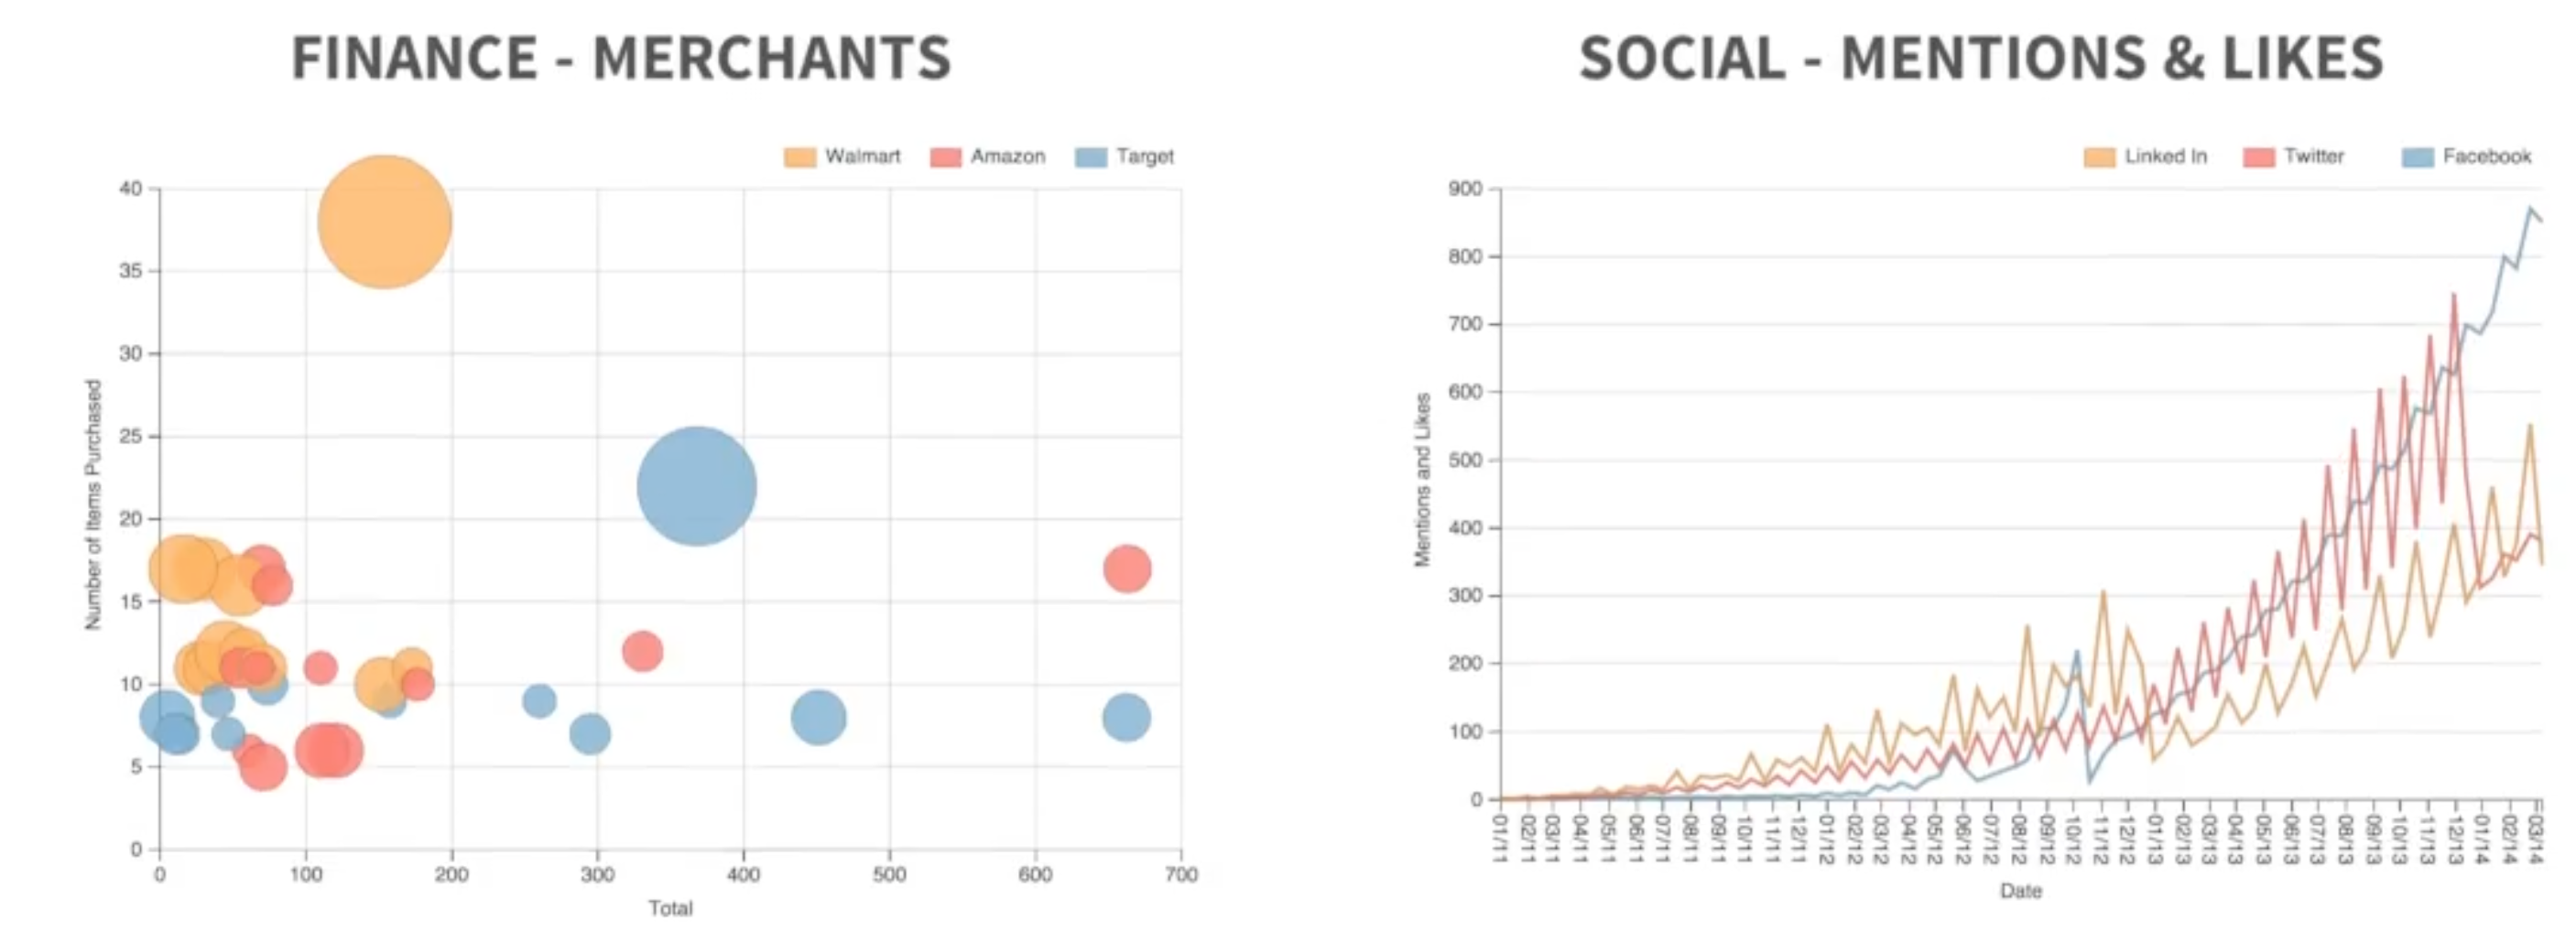
Finance Overview Bubble Chart {Merchants x Item Count x Total Price]
Social Overview Line Chart [Social platform (Twitter, Linked In, Facebook) x Mentions & Likes x Time ]
Time Vertical Gantt Chart [Week x Event Type]
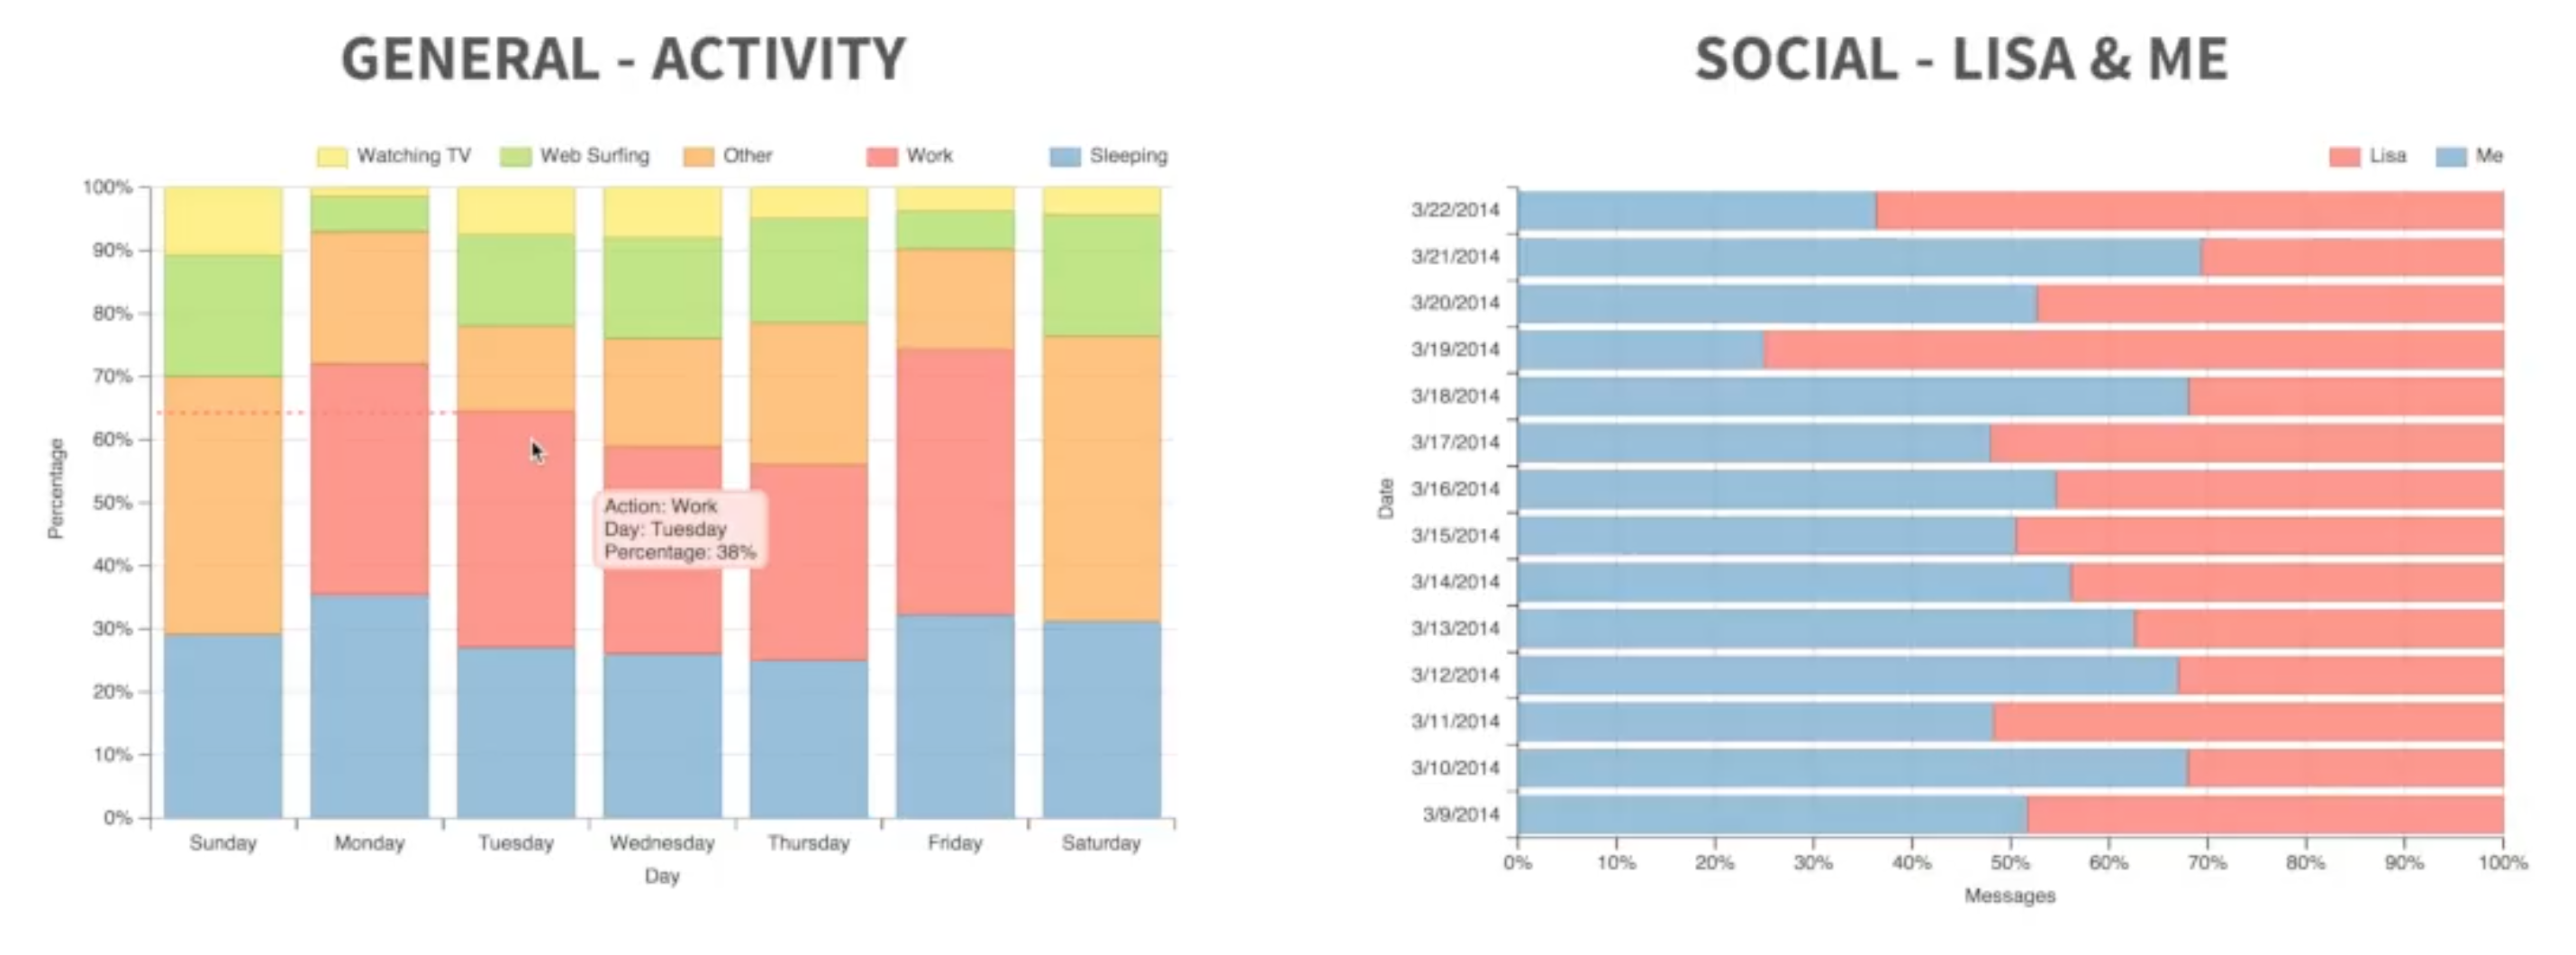
Messaging Bar Chart [% to vs From]
Heat Map of Activity [Location x Time]
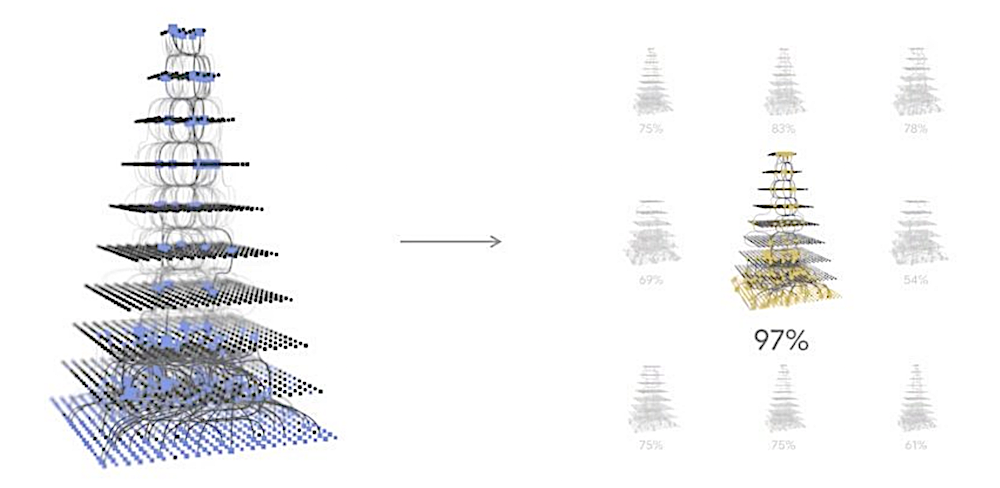
Network Visualizations of Deep Learning Training [Adversarial Match]


