| title | tags | status | |||||
|---|---|---|---|---|---|---|---|
Expose Open Policy Agent/Gatekeeper Constraint Violations with Prometheus and Grafana |
|
draft |
Expose Open Policy Agent/Gatekeeper Constraint Violations for Kubernetes Applications with Prometheus and Grafana
TL;DR: In this blog post, we talk about a solution which gives platform users a succinct view about which Gatekeeper constraints are violated by using Prometheus & Grafana.
Andy Knapp and Murat Celep has worked together on this blog post.
Application teams that just start to use Kubernetes might find it a bit difficult to get into it as Kubernetes is a quiet complex & large ecosystem (see CNCF ecosystem landscape). Moreover, although Kubernetes is starting to mature, it's still being developed very actively and it keeps getting new features at a faster pace than many other enterprise software out there. On top of that, Kubernetes platform deployments into the rest of a company's ecosystem (Authenticaton, Authorization, Security, Network,storage) are tailored specifically for each company due to the integration requirements. So even for a seasoned Kubernetes expert there are usually many things to consider to deploy an application in a way that it fulfills security, resiliency, performance requirements. How can you assure that applications that run on Kubernetes keep fulfilling those requirements?
Open Policy Agent (OPA) and its Kubernetes targeting component Gatekeeper gives you means to enforce policies on Kubernetes clusters. What we mean by policies here, is a formal definition of rules & best practices & behavior that you want to see in your company's Kubernetes clusters. When using OPA, you use a Domain Specific Language called Rego to write policies. By doing this, you leave no room for misinterpretations that would occur if you tried to explain a policy in free text on your company's internal wiki.
Moreover, when using Gatekeeper, different policies can have different enforcement actions. There might be certain policies that are treated as MUST whereas other policies are treated as NICE-TO-HAVE. A MUST policy will stop a Kubernetes resource being admitted onto a cluster and a NICE-TO-HAVE policy will only cause warning messages which should be noted by platform users.
In this blog post, we talk about about how you can:
- Apply example OPA policies, so-called Gatekeeper constraints, to K8S clusters
- Expose prometheus metrics from Gatekeeper constraint violations
- Create a Grafana dashboard to display key information about violations
If you want to read more about enforcing policies in Kubernetes, check out this article.
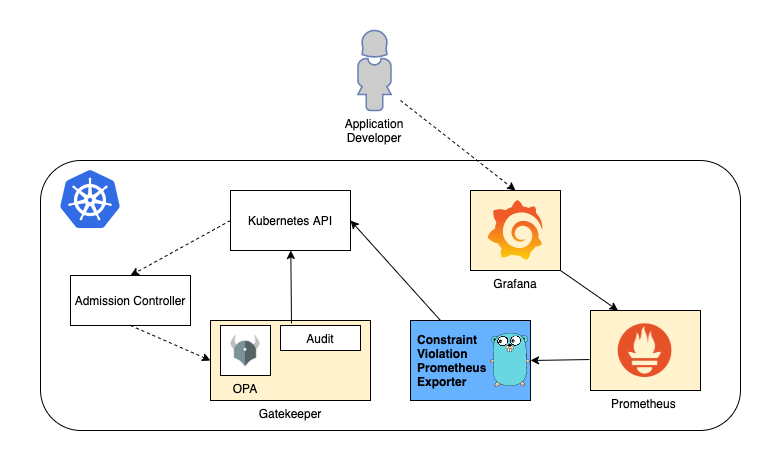
The goal of the system we put together is to provide insights to developers and platform users insights about OPA constraints that their application might be violating in a given namespace. We use Grafana for creating an example dashboard. Grafana fetches data it needs for creating the dashboard from Prometheus. We've written a small Go program - depicted as 'Constraint Violation Prometheus Exporter' in the diagram above - to query the Kubernetes API for constraint violations and expose data in Prometheus format. Gatekeeper/OPA is used in Audit mode for our setup, we don't leverage Gatekeeper's capability to deny K8S resources that don't fulfill policy expectations.
Every company has its own set of requirements for applications running on Kubernetes. You might have heard about the production readiness checklist concept (in a nutshell, you want to create a checklist of items for your platform users to apply before they deploy an an application in production). You want to have your own production readiness checklist based on Rego and these links below might give you a good starting point for creating your own list:
- Application Readiness Checklist on Tanzu Developer Center
- Production best practices on learnk8s.io
- Kubernetes in Production: Readiness Checklist and Best Practices on replex.io
Bear in mind that, you will need to create a OPA policies off of your production readiness checklist and you might not be able to cover all of the concerns you might have in your checklist using OPA/Rego. The goal is to focus on things that are easy to extract based on Kubernetes resources definitions, e.g. number of replicas for a K8S Deployment.
For our blog post, we will be using the open source project gatekeeper-library which contains a good set of example constraints. Moreover, the project structure is quite helpful in the sense of providing an example of how you can manage OPA constraints for your company: Rego language which is used for creating OPA policies should be unit tested thoroughly and in src folder, you can find pure rego files and unit tests. The library folder finally contains the Gatekeeper constraint templates that are created out of the rego files in the src folder. Additionally, there's an example constraint for each template together with some target data that would result in both positive and negative results for the constraint. Rego based policies can get quite complex, so in our view it's a must to have Rego unit tests which cover both happy & unhappy paths. We'd recommend to go ahead and fork this project and remove and add policies that represent your company's requirements by following the overall project structure. With this approach you achieve compliance as code that can be easily applied to various environments.
As mentioned earlier, there might be certain constraints which you don't want to directly enforce (MUST vs NICE-TO-HAVE): e.g. on a dev cluster you might not want to enforce >1 replicas, or before enforcing a specific constraint you might want to give platform users enough time to take the necessary precautions (as opposed to blocking their changes immediately). You control this behavious using enforcementAction. By default, enforcementAction is set to deny which is what we would describe as a MUST condition.
In our example, we will install all constraints with the NICE-TO-HAVE condition using enforcementAction: dryrun property. This will make sure that we don't directly impact any workload running on K8S clusters (we could also use enforcementAction: warn for this scenario).
We decided to use Prometheus and Grafana for gathering constraint violation metrics and displaying them, as these are good and popular open source tools.
For exporting/emitting Prometheus metrics, we've written a small program in Golang that uses the prometheus golang library. This program uses the Kubernetes API to discover all constraints applied to the cluster and export certain metrics.
Here's an example metric:
opa_scorecard_constraint_violations{kind="K8sAllowedRepos",name="repo-is-openpolicyagent",violating_kind="Pod",violating_name="utils",violating_namespace="default",violation_enforcement="dryrun",violation_msg="container <utils> has an invalid image repo <mcelep/swiss-army-knife>, allowed repos are [\"openpolicyagent\"]"} 1
Labels are used to represent each constraint violation and we will be using these labels later in the Grafana dashboard.
The Prometheus exporter program listens on tcp port 9141 by default and exposes metrics on path /metrics. It can run locally on your development box as long as you have a valid Kubernetes configuration in your home folder (i.e. if you can run kubectl and have the right permissions). When running on the cluster a incluster parameter is passed in so that it knows where to look up for the cluster credentials. Exporter program connects to Kubernetes API every 10 seconds to scrape data from Kubernetes API.
We've used this blog post as the base for the code.
Let's go ahead and prepare our components so that we have a Grafana dashboard to show us which constraints have been violated and how the number of violations evolve over time.
- Git: A git cli is required to checkout the repo and
- Kubectl and a working K8S cluster
- Ytt: This is a very powerful yaml templating tool, in our setup it's used for dynamically overlaying a key/value pair in all constraints. It's similar to Kustomize, it's more flexibel than Kustomize and heavily used in some Tanzu products.
- Kustomize: Gatekeeper-library relies on Kustomize, so we need it too.
- Helm: We will install Prometheus and Grafana using helm
- Optional: Docker: Docker is only optional as we already publish the required image on dockerhub.
Run git submodule update --init to download gatekeeper-library dependency. This command will download the gatekeeper-library dependency into folder gatekeeper-library/library.
If your K8S cluster does not come with Gatekeeper preinstalled, you can use install it as explained here. If you are familiar with helm, the easiest way to install is as follows:
helm repo add gatekeeper https://open-policy-agent.github.io/gatekeeper/charts
helm install gatekeeper/gatekeeper --generate-name
We've used Tanzu Mission Control(TMC) to provision a Kubernetes test cluster and TMC gives us a cluster with Gatekeeper on it out of box, we did not have to install Gatekeeper ourselves.
The script gatekeeper-library/apply_gatekeeper_constraints.sh uses kustomize to create constraint templates and then applies them on your cluster. So make sure that k8s cli is configured with the right context. After that Ytt is used to inject spec.enforcementAction: dryrun in order to have an enforcement action of dryrun.
Run the script with the following command:
cd gatekeeper-library && ./apply_gatekeeper_constraints.shIn folder exporter-go there's the source code of the program that exports information about constraint violations in Prometheus data format. The same folder also includes a script called build_docker.sh which builds a container and pushes it to mcelep/opa_scorecard_exporter. Container image is already publicly available though, so the only thing you need to do is to apply the resources that are in folder exporter-k8s-resources. The target namespace we selected for deploying our K8S resources is opa-exporter. The K8S resources we want to create have the following functionality:
clusterrole.yaml&clusterrolebinding.yaml-> These resources create a clusterrole to access all resources of groupconstraints.gatekeeper.shand a binding for that clusterroledeployment.yaml-> A deployment that will run the container imagemcelep/opa_scorecard_exporterservice.yaml-> A service that has annotationprometheus.io/scrape-slow: "true"to make sure that this service gets picked up by Prometheus
To apply these K8S resources:
kubectl create namespace opa-exporter && kubectl -n opa-exporter apply -f exporter-k8s-resourcesFor installing Prometheus & Grafana, we will use a helm chart called kube-prometheus-stack. Folder kube-prometheus-stack includes the relevant files for this step.
Along with Prometheus and Grafana, we also want to install a custom Grafana Dashboard that will display useful metrics about constraint violations. File kube-prometheus-stack/cm-custom-dashboard.yaml contains the dashboard configuration that we want to install, note the label grafana_dashboard: "1" in this file. This label is used as a directive for Grafana to pick up the content of this ConfigurationMap as a dashboard source. The file grafana-opa-dashboard.json is a raw JSON export from Grafana and we used the content of this file to embed it into the configmap under key opa-dashboard.json.
The install script kube-prometheus-stack/install.sh creates a ConfigMap from file cm-custom-dashboard.yaml and then it uses helm to install kube-prometheus-stack chart into the namespace prometheus.
Run the following command to install Prometheus & Grafana:
cd kube-prometheus-stack && ./install.shAfter a few moments, all Prometheus components and Grafana should be up and running.
We haven't provided an ingress or a service of type: LoadBalancer for our Grafana installation so the easies way to access our Grafana dashboard is by using port-forwarding from kubectl.
Execute the following command to start a port-forwarding session to Grafana:
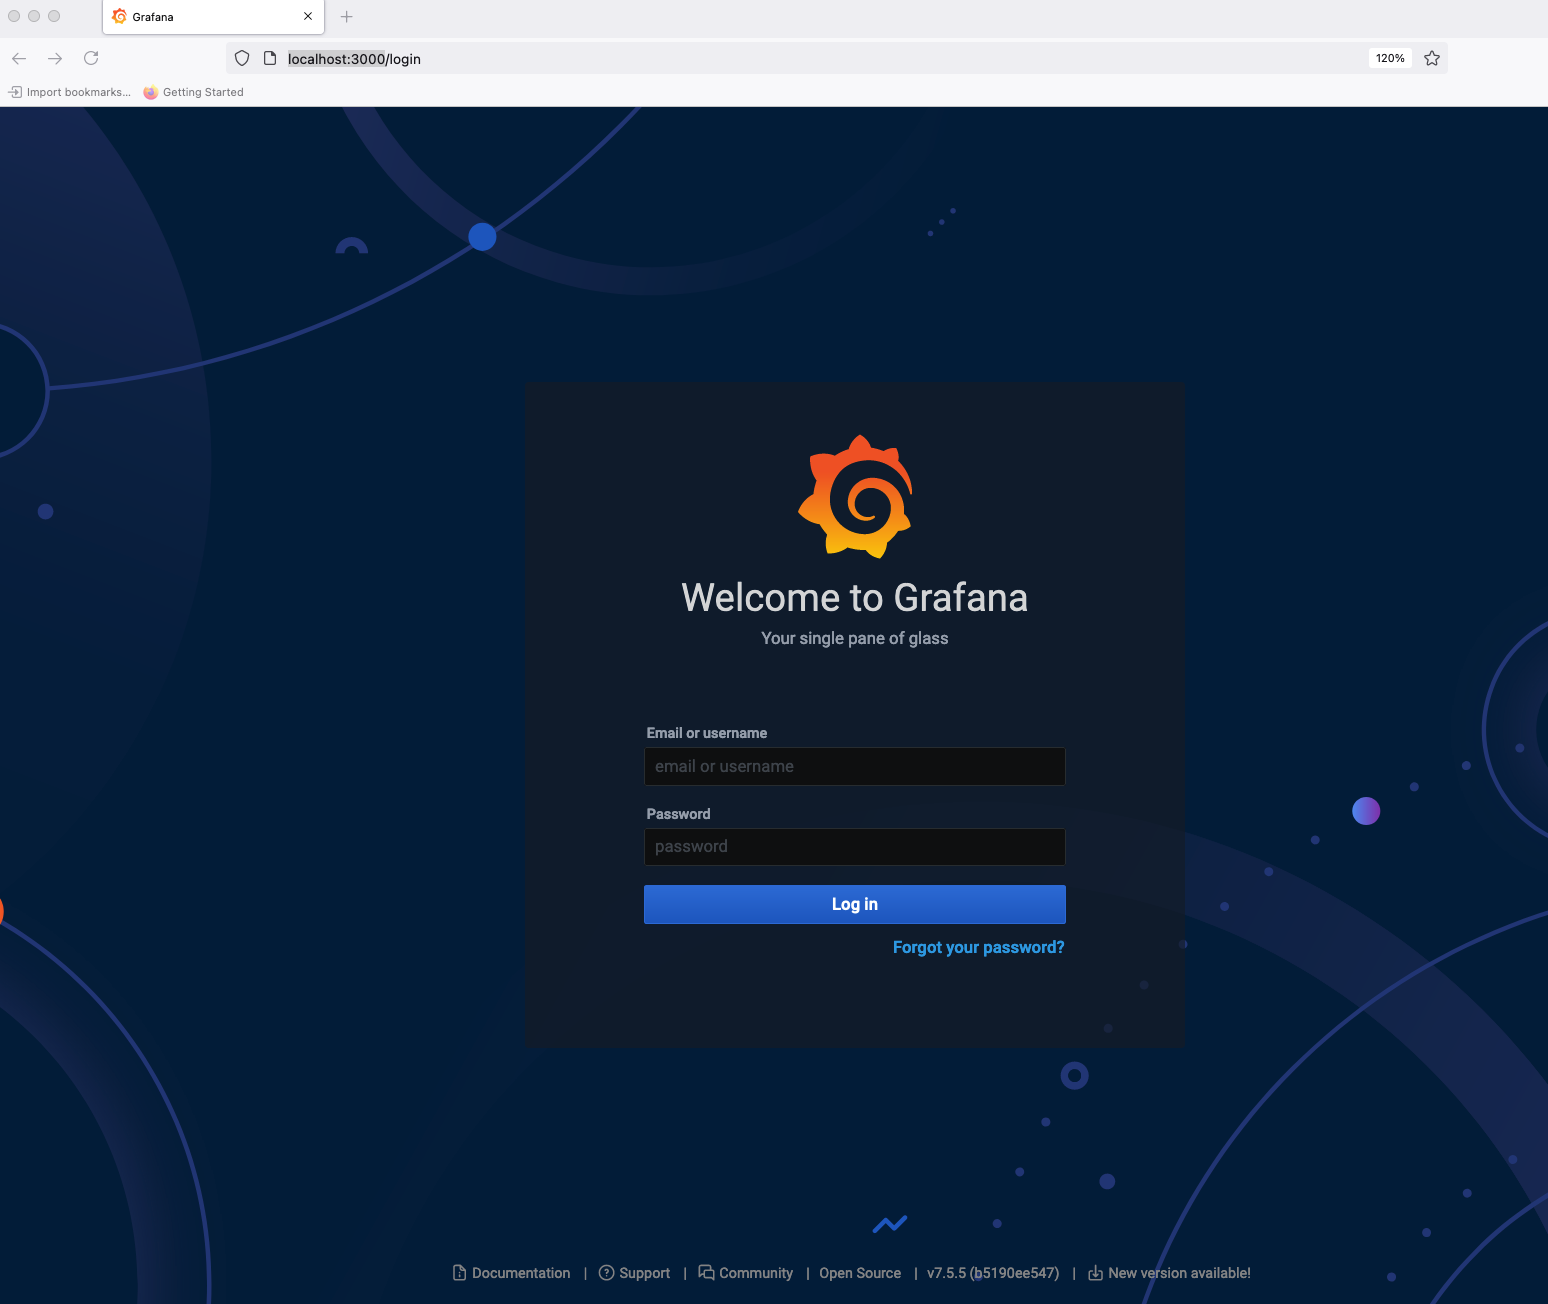
kubectl -n prometheus port-forward $(kubectl -n prometheus get pod -l app.kubernetes.io/name=grafana -o name | cut -d/ -f2) 3000:3000You can now hit the following url: http://localhost:3000 with your browser and you should see a welcome screen that looks like the screenshot below.
The default username/password for Grafana as of this writing is admin / prom-operator. If these credentials do not work out you can also discover them via the following commands:
kubectl -n prometheus get secrets prometheus-grafana -o jsonpath='{.data.admin-user}' | base64 -d
kubectl -n prometheus get secrets prometheus-grafana -o jsonpath='{.data.admin-password}' | base64 -d
Once you are logged in to Grafana you directly go to OPA Dasboard via http://localhost:3000/d/YBgRZG6Mz/opa-violations?orgId=1 (or search for the OPA dashboard via this link: http://localhost:3000/dashboards?query=opa).
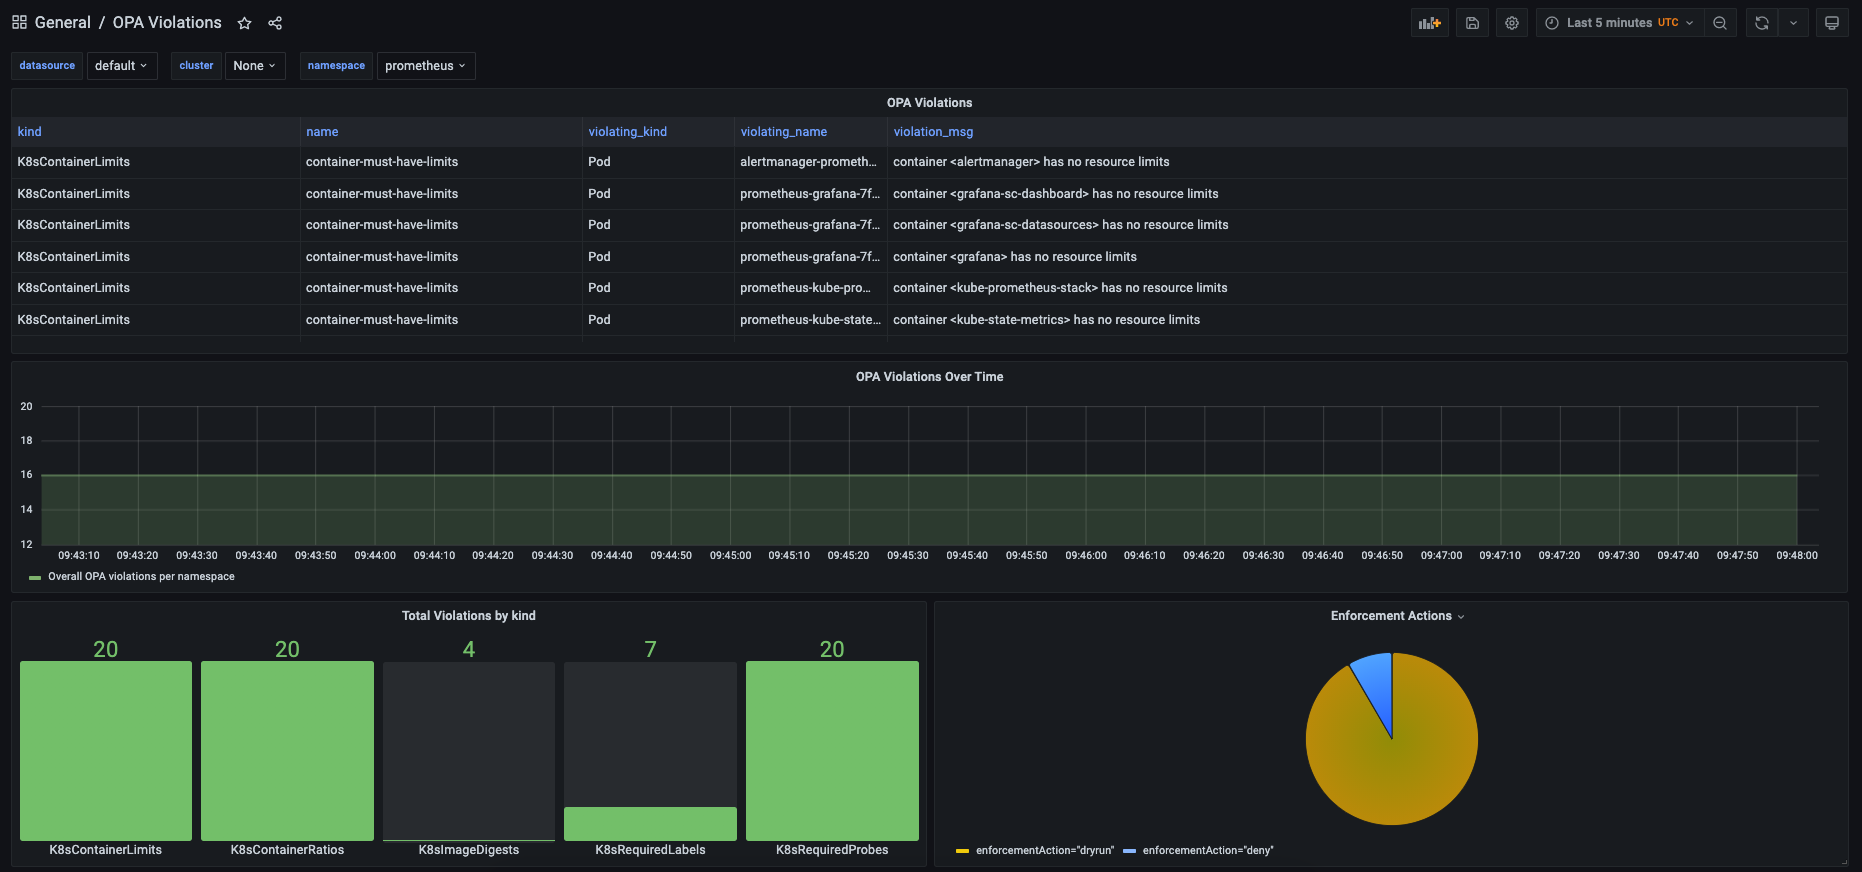
Below is a screenshot of the Grafana OPA dashboard we created:
You can select a target namespace from the drop-down menu on the upper section of the dashboard. We left the dashboard quite simple, obviously you can extend in endless ways and feel free to share your dashboards by making pull requests to this repo.


