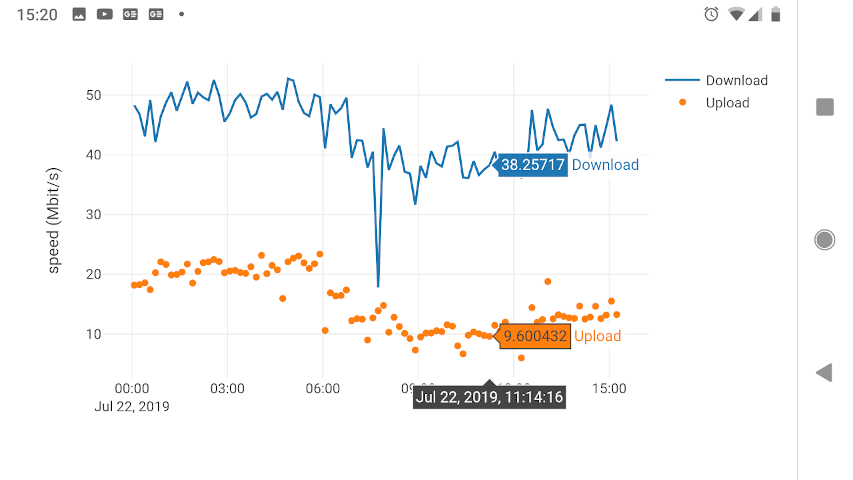
Visualize data generated by speedtest-cli in a web app powered by Plotly


Web app for visualizing internet uplink speeds. Environments supported so far:
- Docker container
- GNU/Linux hosts with Python >= 3.6 installed
(Other POSIX systems and Windows need testing.)
- Added line plot with selectable window size
- Added 3D graph for download speed densities
Get up and running instantly, with a speedtest.csv file in your home dir and logs written to stdout.
# Please adapt details (container timezone, sitename) to your needs.

docker run -ti -p 80:5000 -v ~:/root -e FLASK_DEBUG=1 -e "TZ=EST" \
   -e "INFILE=/root/speedtest.csv" -e "SITENAME=my provider" \
   shuntingyard/speedtest_http
pip install speedtest_http
or
easy_install speedtest_http
pip install git+https://github.com/shuntingyard/speedtest_http.git
or
git clone https://github.com/shuntingyard/speedtest_http.git
cd speedtest_http
python setup.py install
# Please adapt env variables, host, port according to your needs.

INFILE=~/data/speedtest.csv \
LOGDIR=/tmp \
SITENAME="my provider" \
FLASK_APP=speedtest_http \
FLASK_DEBUG=0 \
python -m flask run -h 0.0.0.0 -p 8080
- Line plot with selectable window size
- 3D graph for download speed densities
- Using new speedtest_reader API
- All graphs migrated from Dash to Plotly
