By default, even if you would put a breakpoint in Avalonia main repo directly it would not be hit when Previewer executes this code. This is because Previewer is a completely different process usually run by IDE.
But how do we debug it then?
You may try to attach the debugger manually. For doing that you will need to find a previewer process. You may use e.g "Process Hacker". Here you will see all processes in the system. Everything you will need to do is to type Avalonia in the search field.
In my case process was called .NET Host. You can understand that this process is Avalonia Previewer by clicking with the right mouse button on the process and selecting "Properties".Here in the "Command line" field, you will see a command that invokes previewer.
When you know the process id you can simply click "Debug" in process explorer. But sometimes previewer process may crash even before you would attach your debugger. Then you will need to modify this file Program.cs specifically method Main(one of them depending on target framework).
Debugger.Launch();
while (!Debugger.IsAttached)
  Thread.Sleep(100);
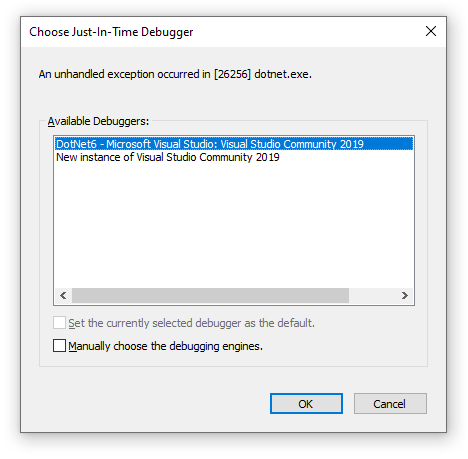
This code will attach debugger to the previewer programmatically.
How would I understand that I have launched a debugger?
You should see a window like this.


