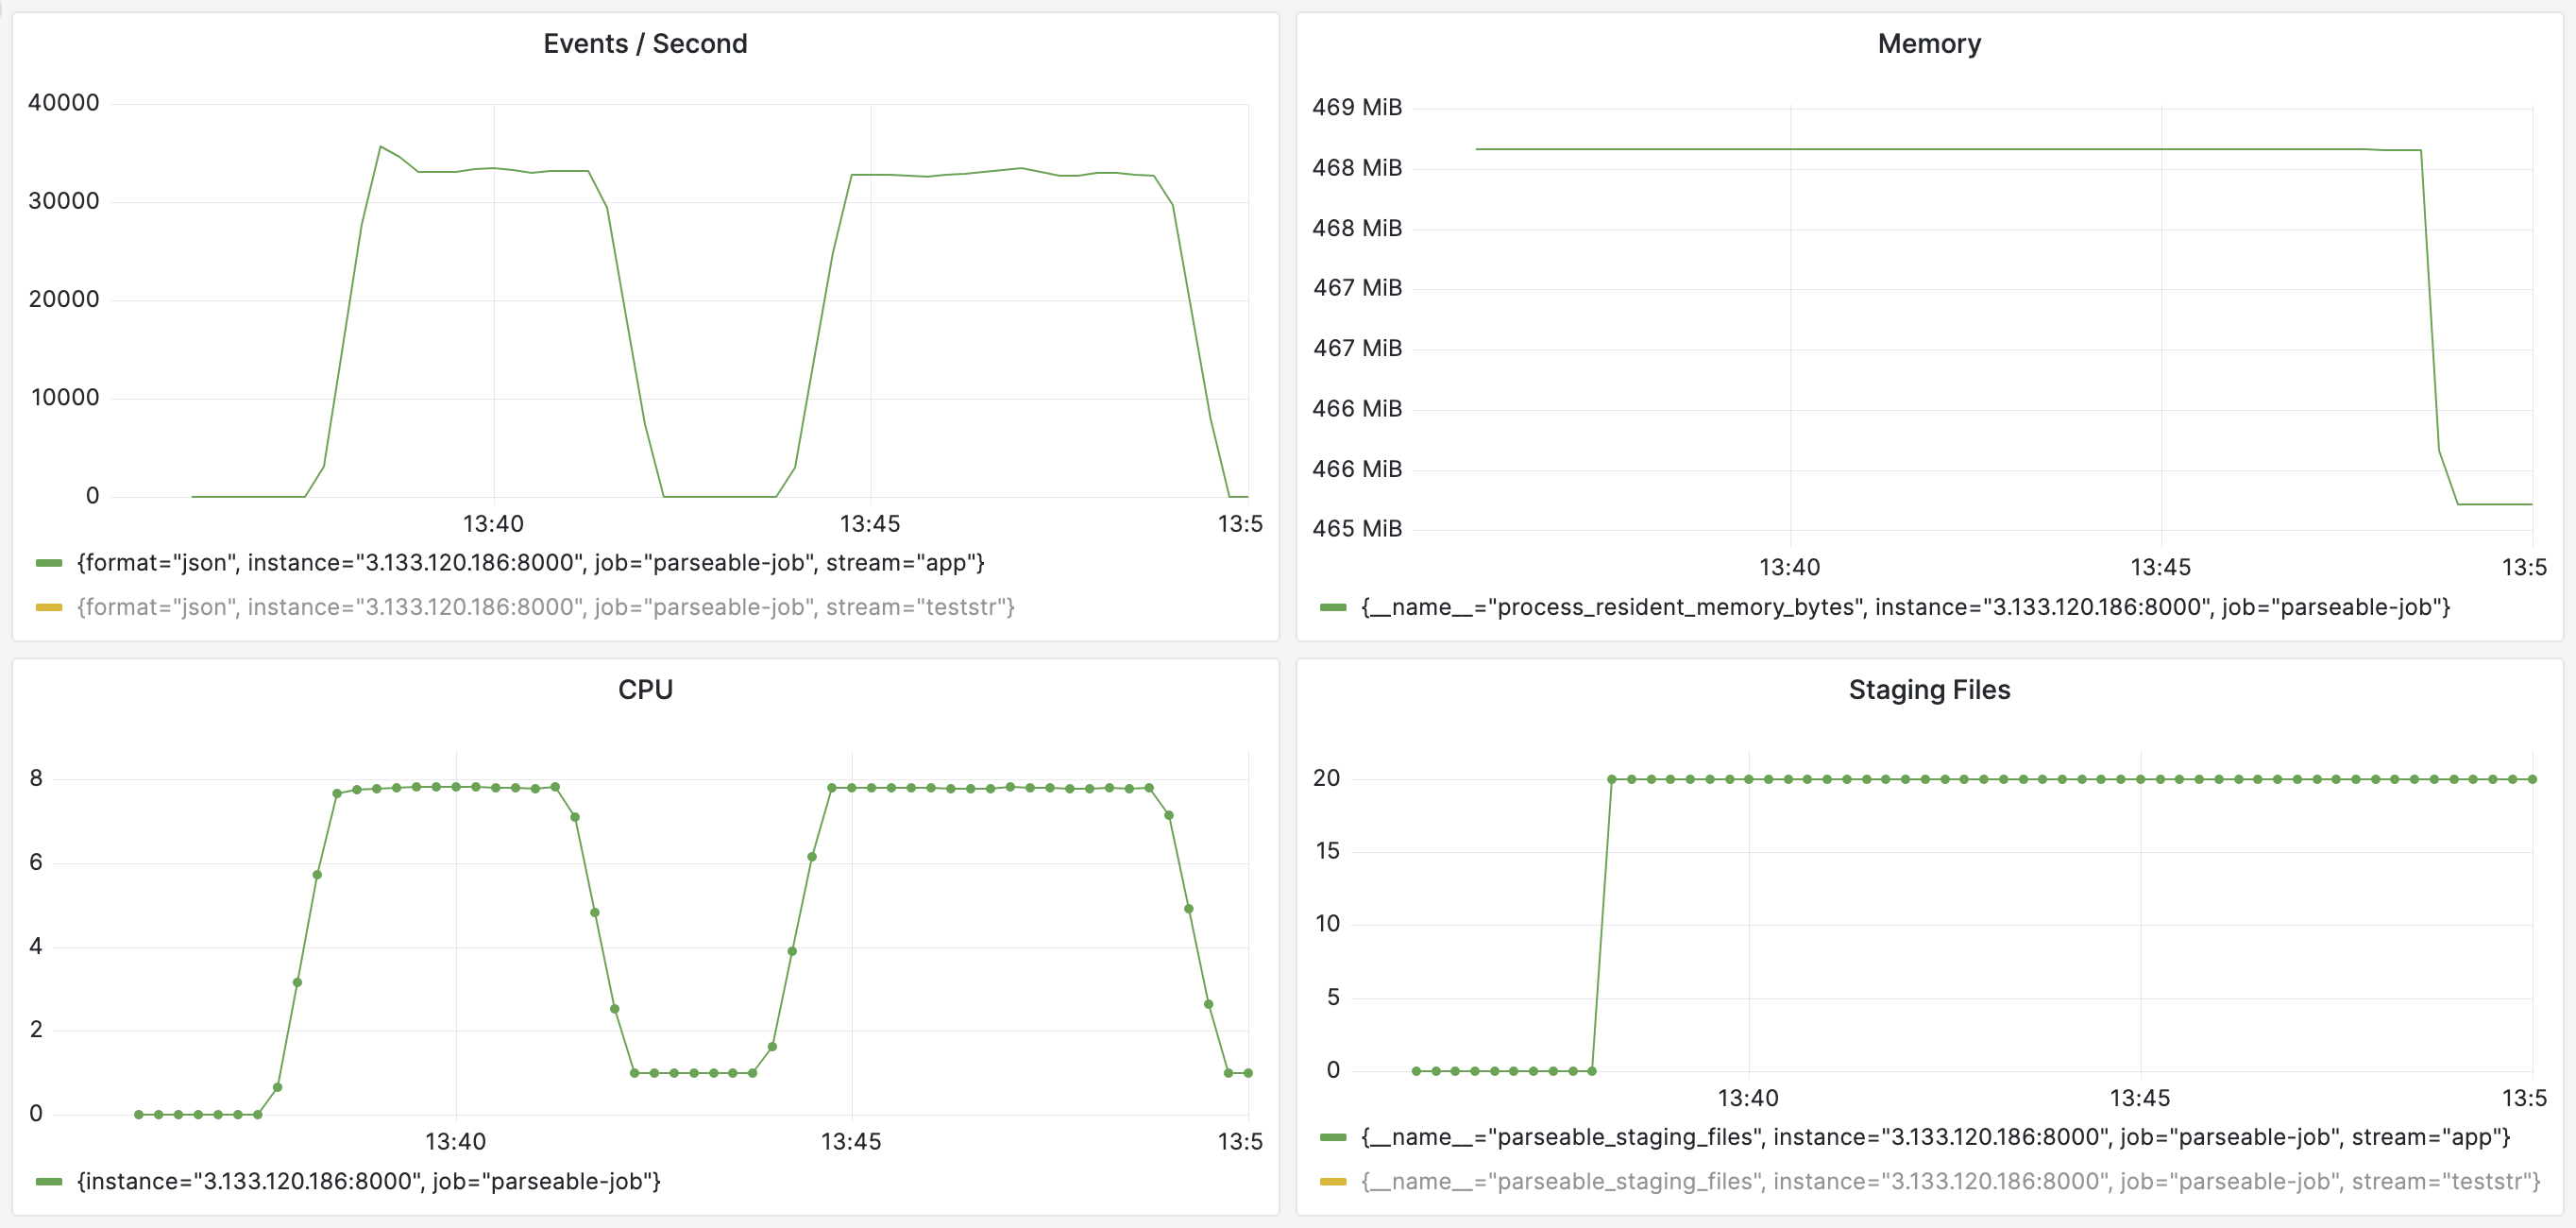
We use K6 to benchmark Parseable. This document contains the results of our benchmarks and steps to run your own benchmarks in your environment to understand Parseable's performance characteristics.
- Parseable version:
v0.3.0 - Server Instance: AWS EC2
c4.2xlarge(8 vCPU, 15 GiB RAM). Refer further details here. - Client Instance: AWS EC2
c4.8xlarge(36 vCPU, 60 GiB RAM). Refer further details here.
- Parseable is CPU bound. CPU was 100% with lot of memory and disk iops left.
- Since we had a single client, it needed much more CPU to saturate Parseable. It would be ideal to test with distributed clients. But we expect similar performance from Parseable.
- Parseable reached
32829.535634/sin this setup.
k6 run load.js --vus=700 --duration=5m

          /\      |‾‾| /‾‾/   /‾‾/
     /\  /  \     |  |/  /   /  /
    /  \/    \    |     (   /   ‾‾\
   /          \   |  |\  \ |  (‾)  |
  / __________ \  |__| \__\ \_____/ .io

  execution: local
     script: load.js
     output: -

  scenarios: (100.00%) 1 scenario, 700 max VUs, 5m30s max duration (incl. graceful stop):
           * default: 700 looping VUs for 5m0s (gracefulStop: 30s)


     data_received..................: 1.5 GB  5.0 MB/s
     data_sent......................: 8.0 GB  27 MB/s
     http_req_blocked...............: avg=19.35µs min=0s       med=4.78µs   max=431.69ms p(90)=7.35µs   p(95)=9.81µs
     http_req_connecting............: avg=3.79µs  min=0s       med=0s       max=73.48ms  p(90)=0s       p(95)=0s
     http_req_duration..............: avg=76.17ms min=344.43µs med=65.01ms  max=636.72ms p(90)=128.99ms p(95)=149.54ms
       { expected_response:true }...: avg=76.17ms min=344.43µs med=65.01ms  max=636.72ms p(90)=128.99ms p(95)=149.54ms
     http_req_failed................: 0.00%   ✓ 0            ✗ 9858220
     http_req_receiving.............: avg=541.7µs min=0s       med=22.49µs  max=218.44ms p(90)=164.95µs p(95)=389.52µs
     http_req_sending...............: avg=90.17µs min=0s       med=21.07µs  max=485.95ms p(90)=40.19µs  p(95)=146.16µs
     http_req_tls_handshaking.......: avg=0s      min=0s       med=0s       max=0s       p(90)=0s       p(95)=0s
     http_req_waiting...............: avg=75.54ms min=299.31µs med=64.81ms  max=482.88ms p(90)=127.43ms p(95)=147.69ms
     http_reqs......................: 9858220 32829.535634/s
     iteration_duration.............: avg=426.2ms min=195.51ms med=422.99ms max=1.18s    p(90)=499.06ms p(95)=522.91ms
     iterations.....................: 492911  1641.476782/s
     vus............................: 700     min=700        max=700
     vus_max........................: 700     min=700        max=700


running (5m00.3s), 000/700 VUs, 492911 complete and 0 interrupted iterations
default ✓ [======================================] 700 VUs 5m0sNOTE: Benchmarks are nuanced and very much environment specific. So we recommend running benchmarks in the target environment to get an understanding of actual performance.
We have created a K6 script to load test a Parseable instance. The script is available here.
Make sure to change the env vars as per your setup. Also fine tune vu and duration as per your needs.
export P_URL="https://demo.parseable.io" # Parseable URL
export P_STREAM="test" # Parseable stream
export P_USERNAME="admin" # Parseable username
export P_PASSWORD="admin" # Parseable password
export P_SCHEMA_COUNT=20 # Number of different types of json formats to be sent to this stream
k6 run --vus=700 --duration=5m https://raw.githubusercontent.com/parseablehq/quest/main/testcases/load.jsCurrently Elastic public benchmarks published here: https://www.elastic.co/blog/benchmarking-and-sizing-your-elasticsearch-cluster-for-logs-and-metrics.
As per this benchmark, Elastic is able to ingest 22000 events per second per node. Node specs: 8 vCPU, 32 GiB RAM.
