-
Notifications
You must be signed in to change notification settings - Fork 121
New issue
Have a question about this project? Sign up for a free GitHub account to open an issue and contact its maintainers and the community.
By clicking “Sign up for GitHub”, you agree to our terms of service and privacy statement. We’ll occasionally send you account related emails.
Already on GitHub? Sign in to your account
Discussion: How memlab supports NodeJS memory leak detection #30
Comments
|
@foreseaz For node.js leak detection, you can take heap snapshots via takeNodeFullHeap, then use the following command to find memory leaks: The built-in leak detector in MemLab is mainly for front-end memory leaks, so you need to defined a leak filter (API and example). The most naive leak filter would be returning |
|
@JacksonGL thanks for documenting this. Few questions, can you share an example of a filter definition syntax I can try? Do I pass it the filter definition file? Can you share the syntax. Also when taking |
Here are a few leak filter examples.
Yes Leak filter documentation: https://facebook.github.io/memlab/docs/api/interfaces/core_src.ILeakFilter/
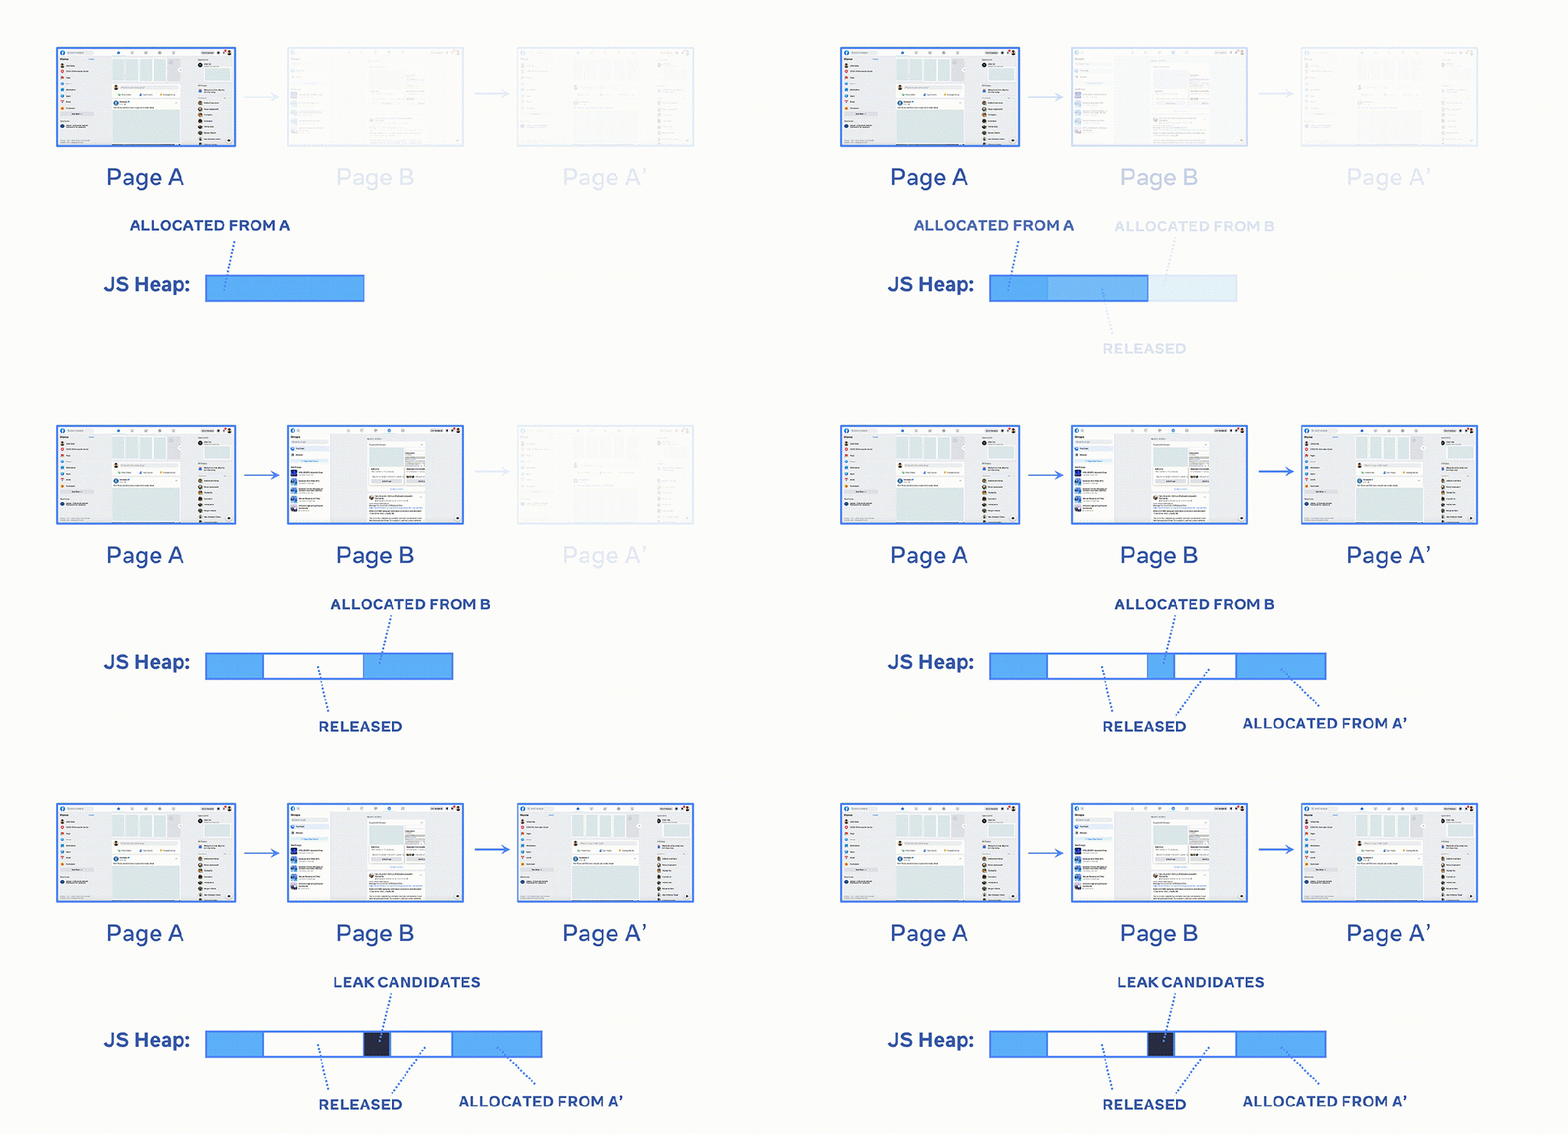
Yes, they are 3 separate heap snapshots, for more information please check out: baseline, target, and final corresponds to snapshot of A, B, and A' in the following animation: |
|
@JacksonGL Thanks for the detailed reply. When should I take the three snapshots of my leaked nodejs application? In my case, the memory occupation keeps rising in my application. |
|
@dennyak47 You can import and call this API to take heap snapshot from node.js: In your case, just take three heap snapshots when the memory footprint is rising. For example, one heap snapshot when heap usage is 50MB (as baseline), another at 80MB (as target), and third heap snapshot at 100MB (as final). If you are using the Alternatively you can write your own leak detector for node.js: Here is an example on how to save the heap snapshot to disk, or to load the heap snapshot from disk: There are a few other heap anslysis commands that may be useful (check out by running |

Hi memlab devs, thanks for the great tool. I'm excited to try to integrate it into my current NodeJS app tests. I'm wondering what's current status or future road map is on supporting NodeJS memory leak detection.
Currently, most test cases and demos are running in browsers detecting front-end side memory leaks. Would you plan to give more support on NodeJS?
The text was updated successfully, but these errors were encountered: