Kanaries focus on Augmented Analytics and Automated Visualization Design.
| Solution | Description | Image |
|---|---|---|
| Rath | An automatic Exploratory Data Analysis(auto-EDA) system which helps extract insights and generate charts and interactive dashboard. | |
| PyGWalker | Turn your data into an interactive UI for data exploration. It allows you to visualize your data with simple drag-and-drop operations. |  |
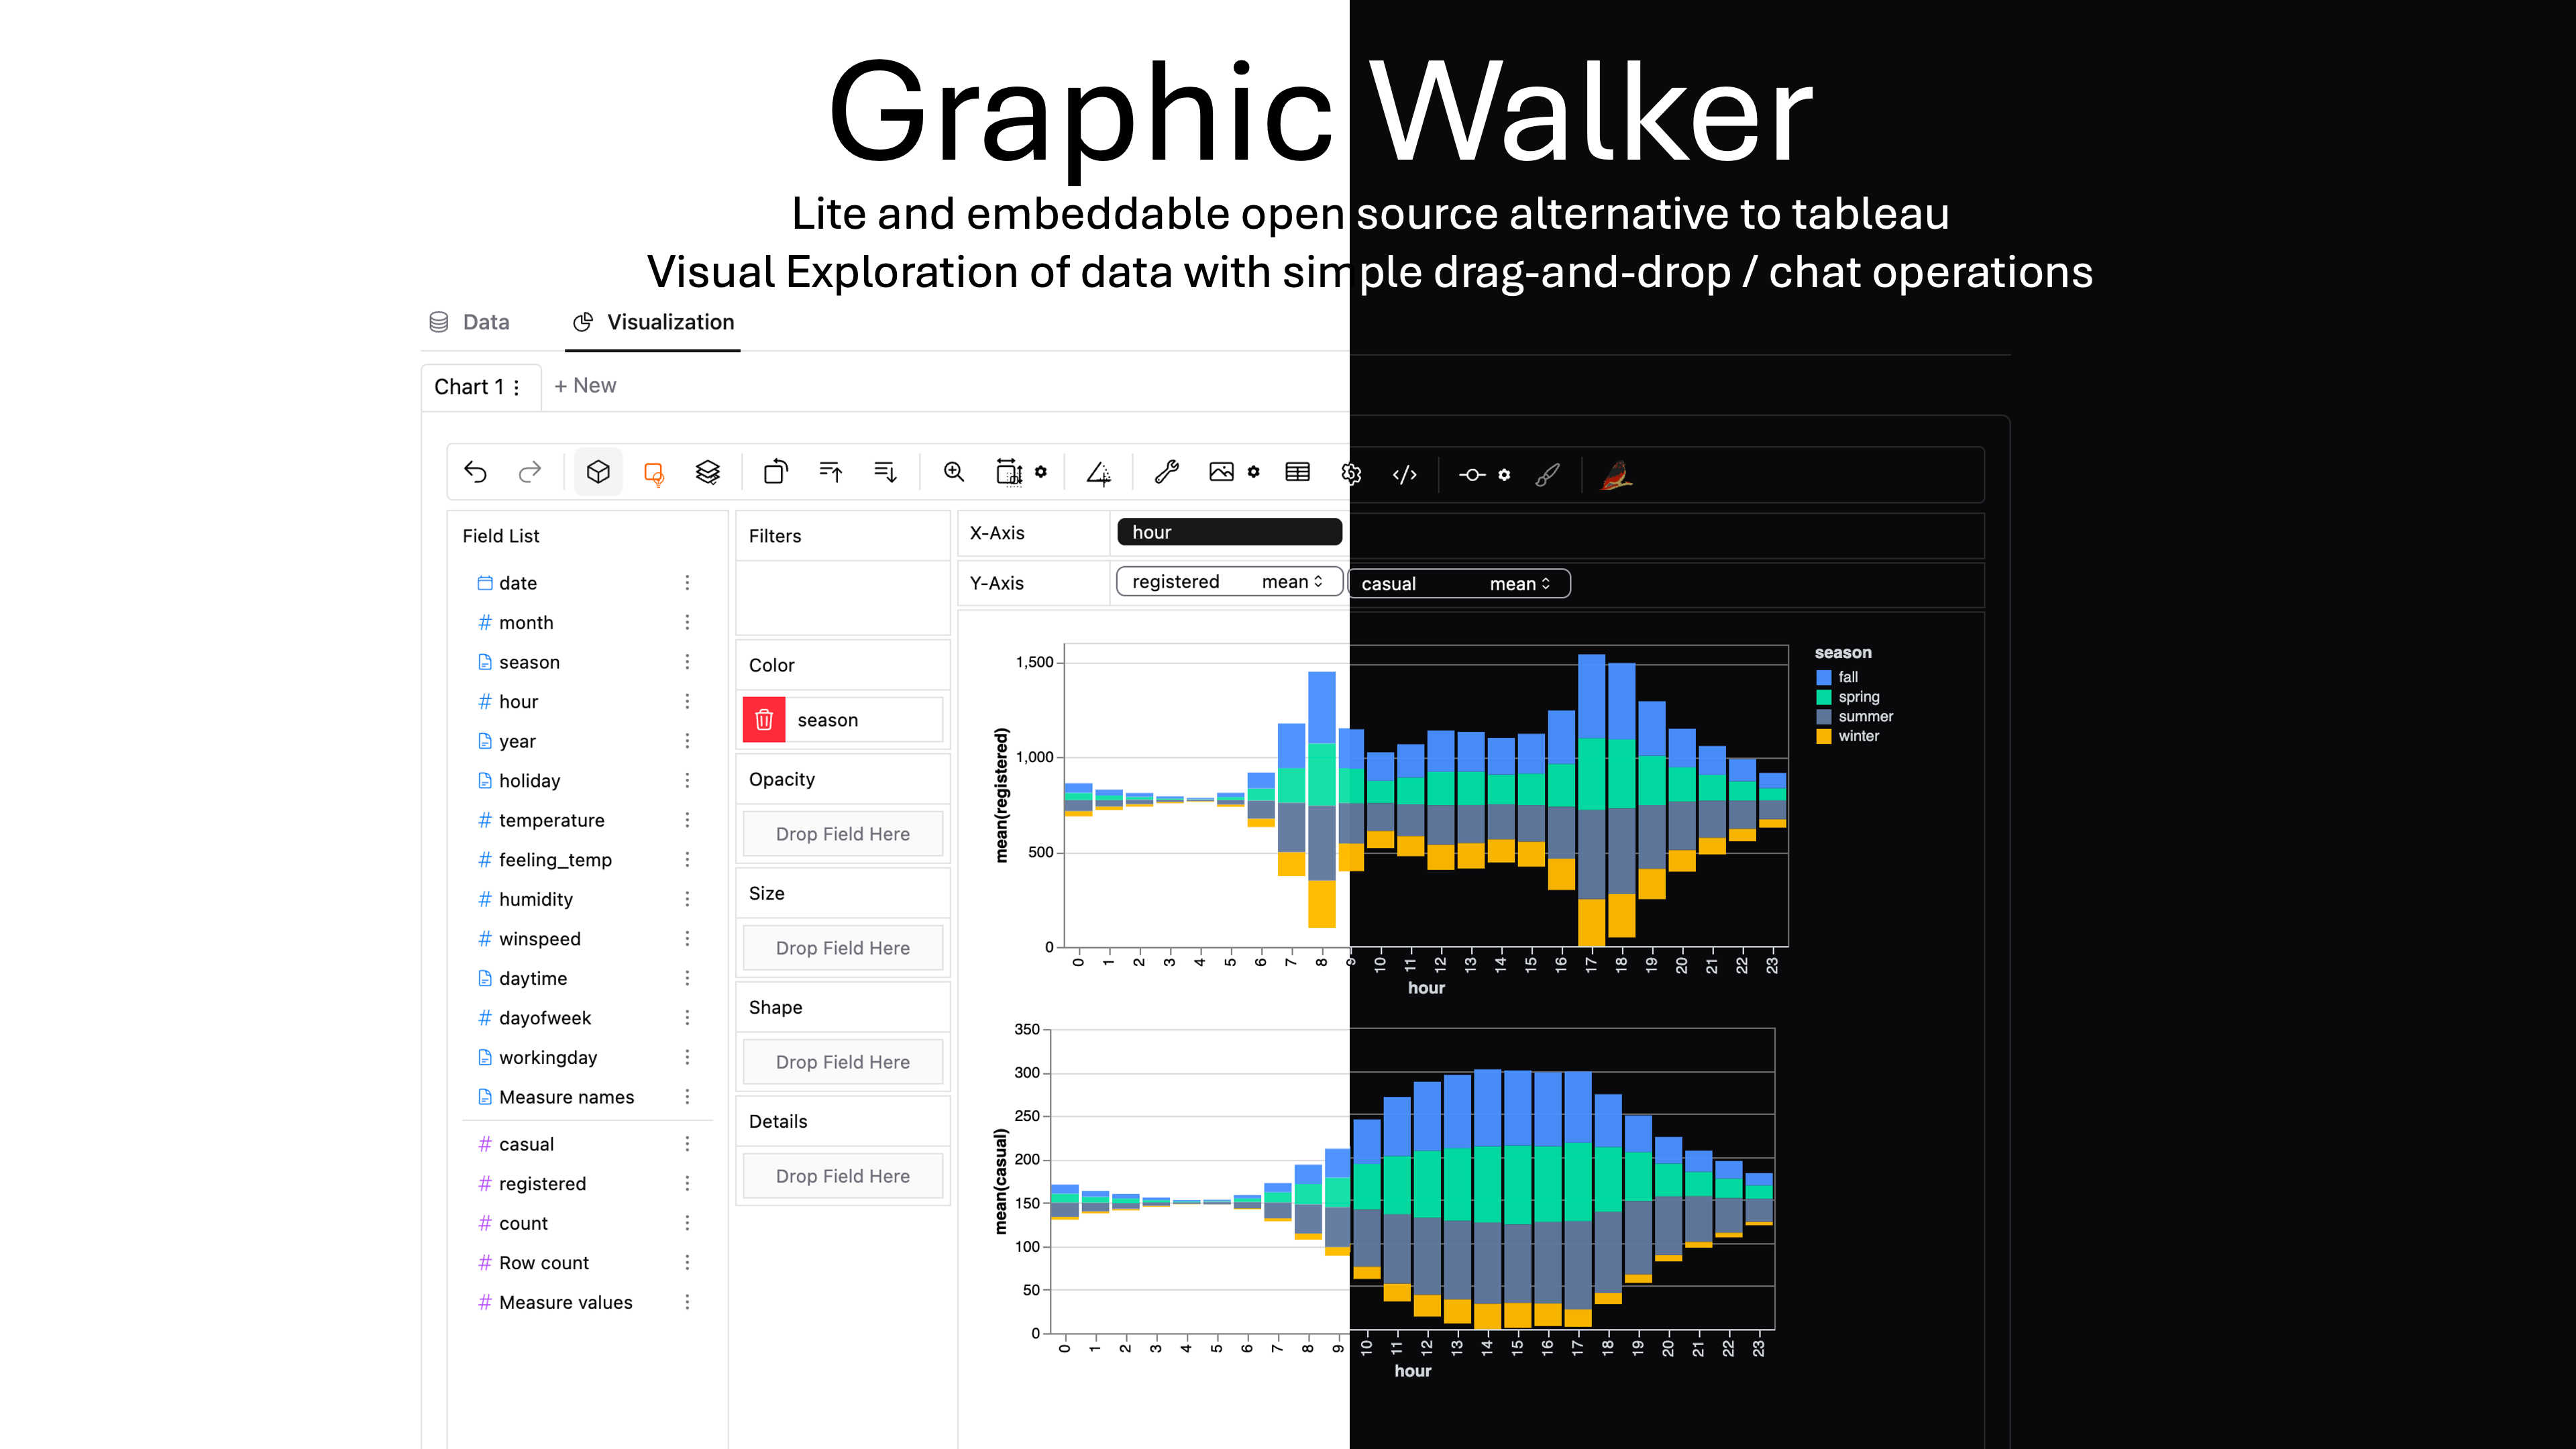
| Graphic Walker | Embeddable analytic solution, embed an interactive visual analytic component in your system. |  |
| lab2 | AI generated data apps, building data apps with simple text prompts | Comming Soon! |
