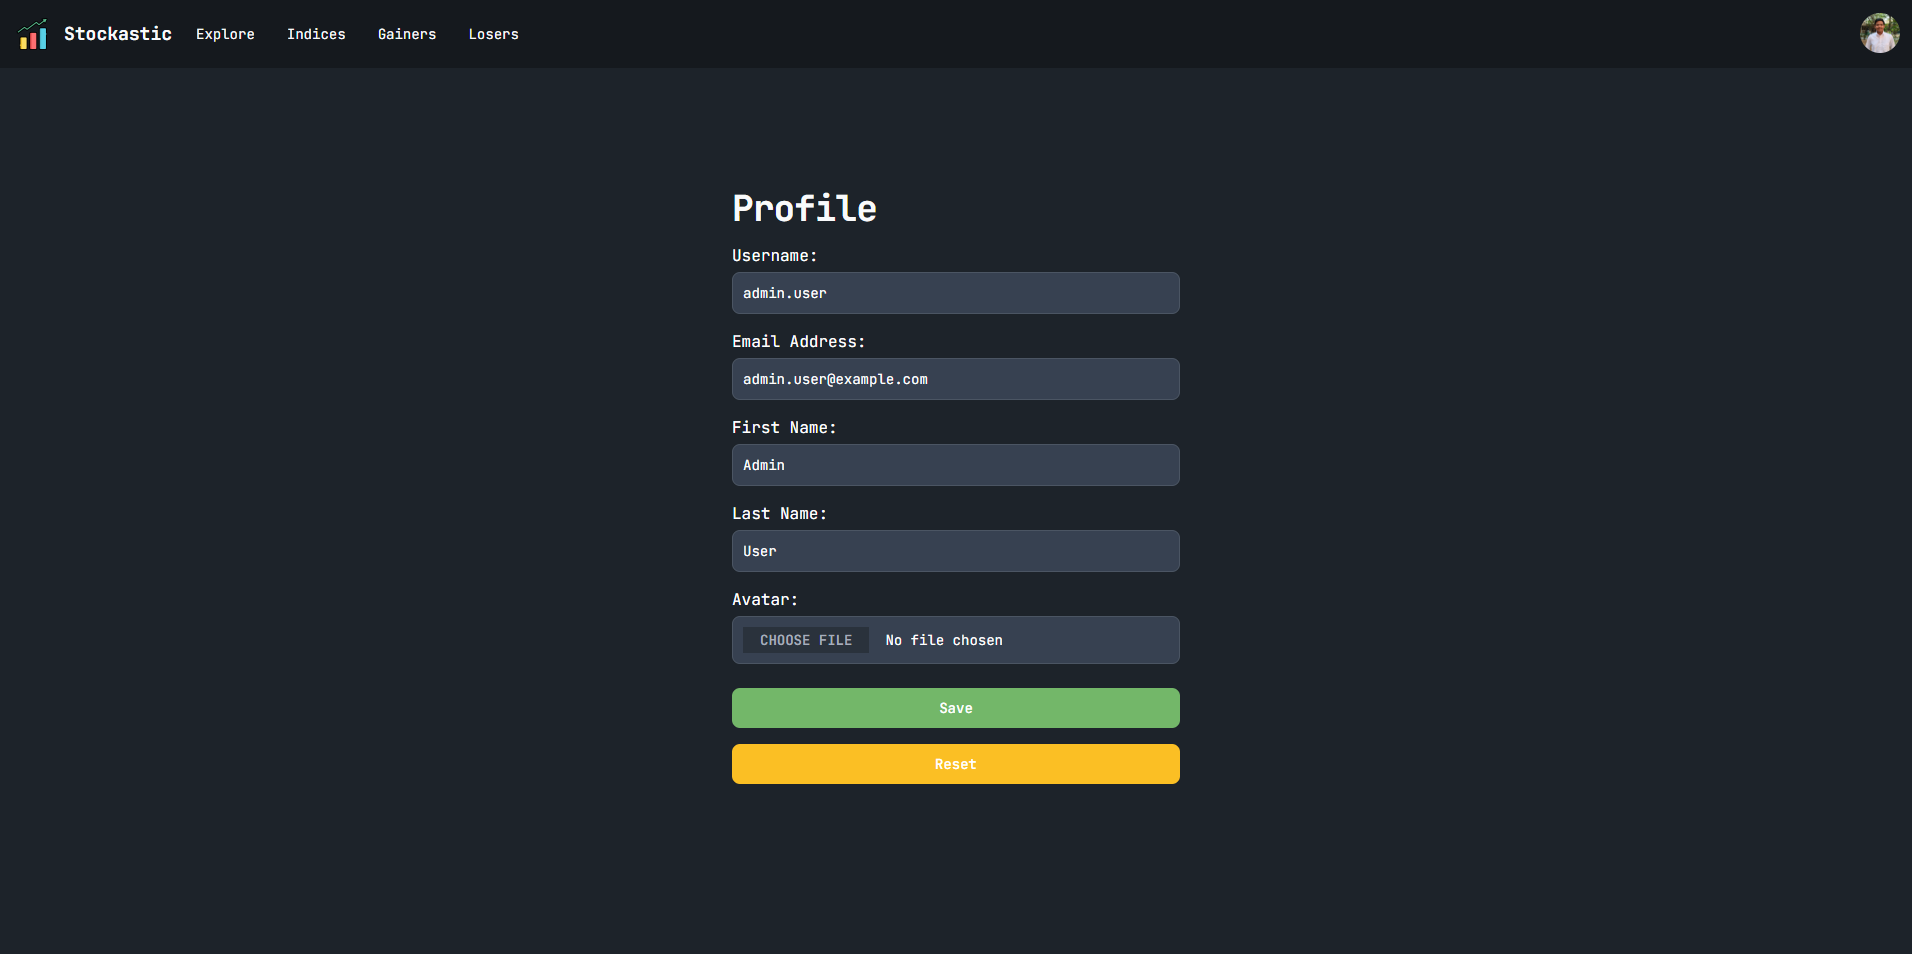
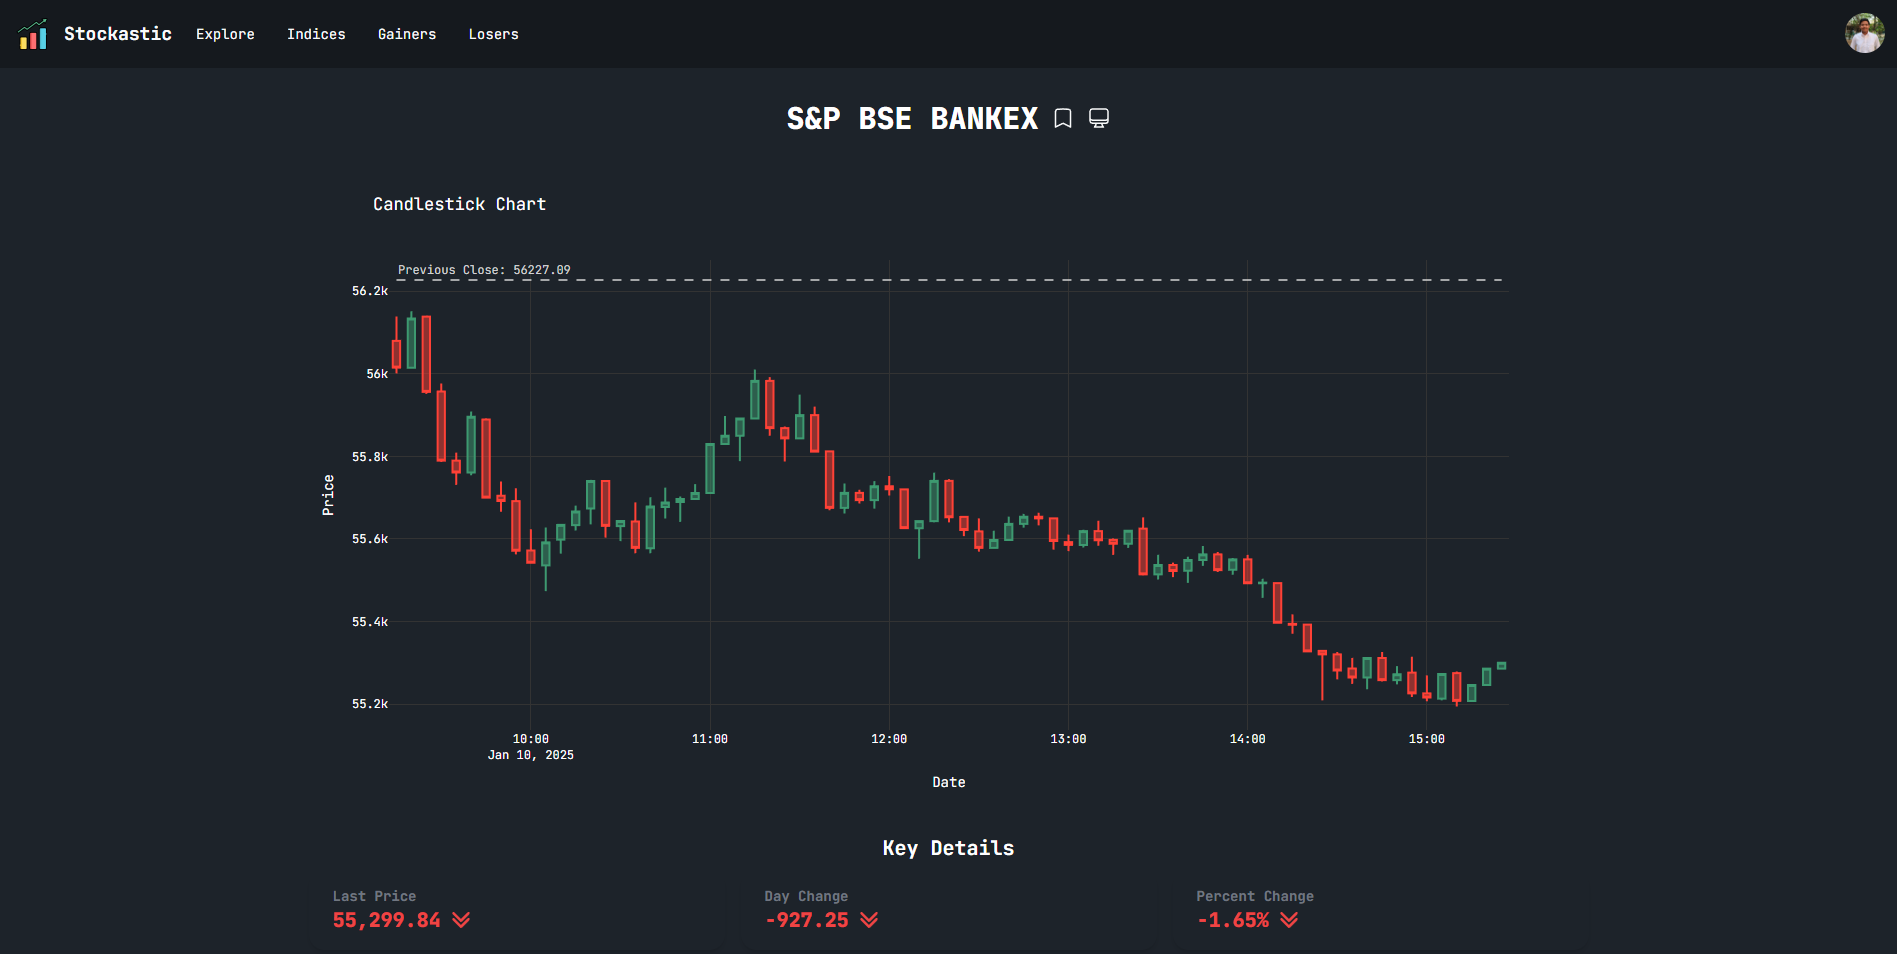
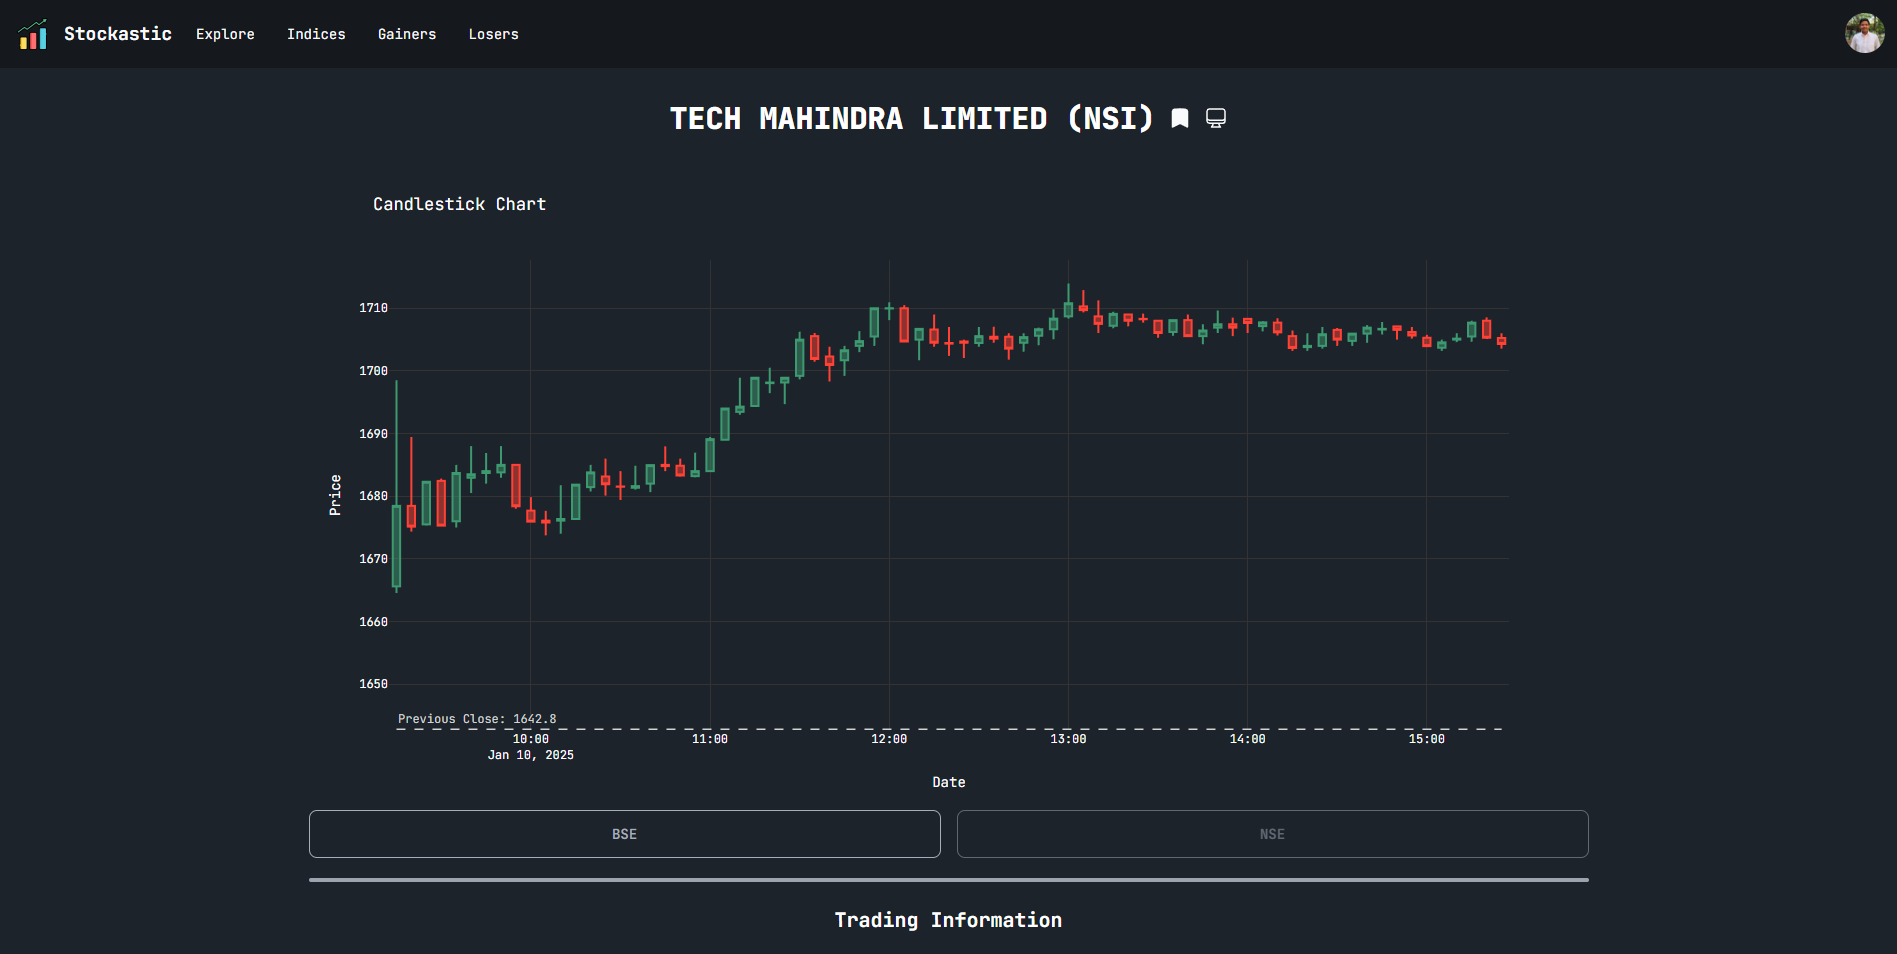
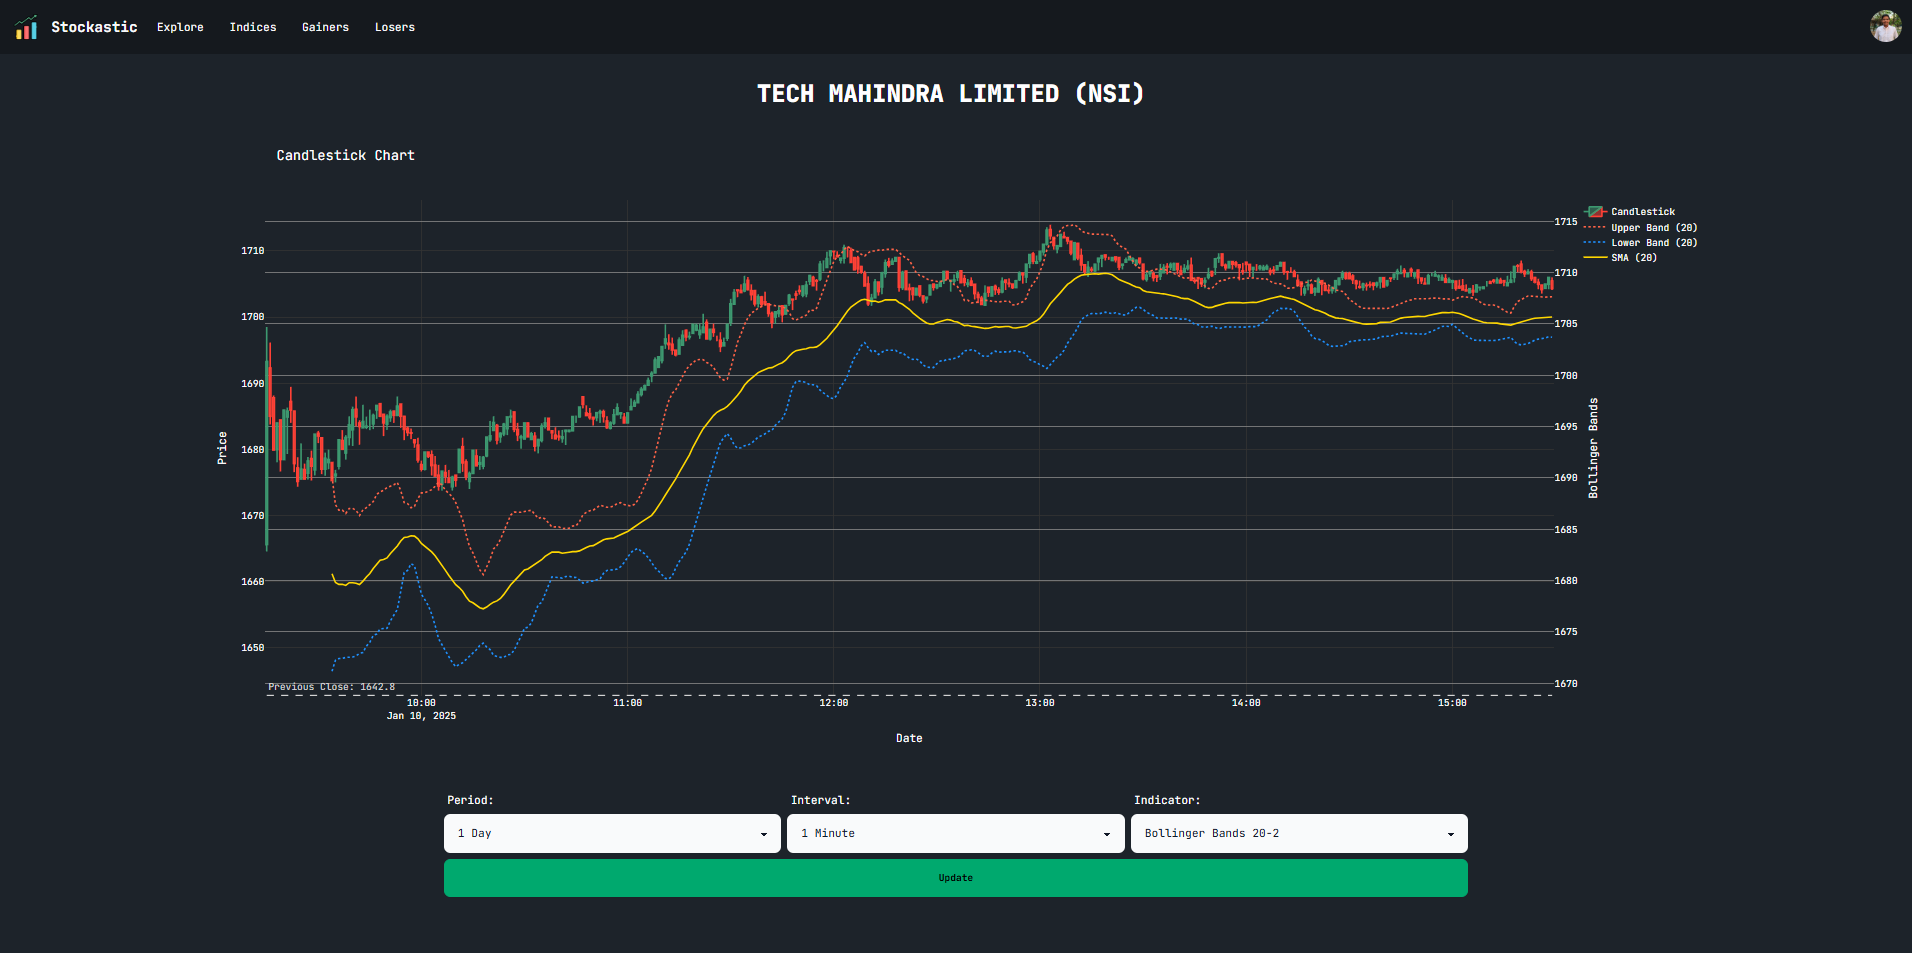
A comprehensive stock monitoring platform providing real-time investment insights with secure authentication. Track your favorite stocks and visualize performance through interactive Plotly graphs with advanced technical analysis capabilities.
- Real-time Data Streaming: Utilizing WebSockets for live market updates
- Comprehensive Market Coverage:
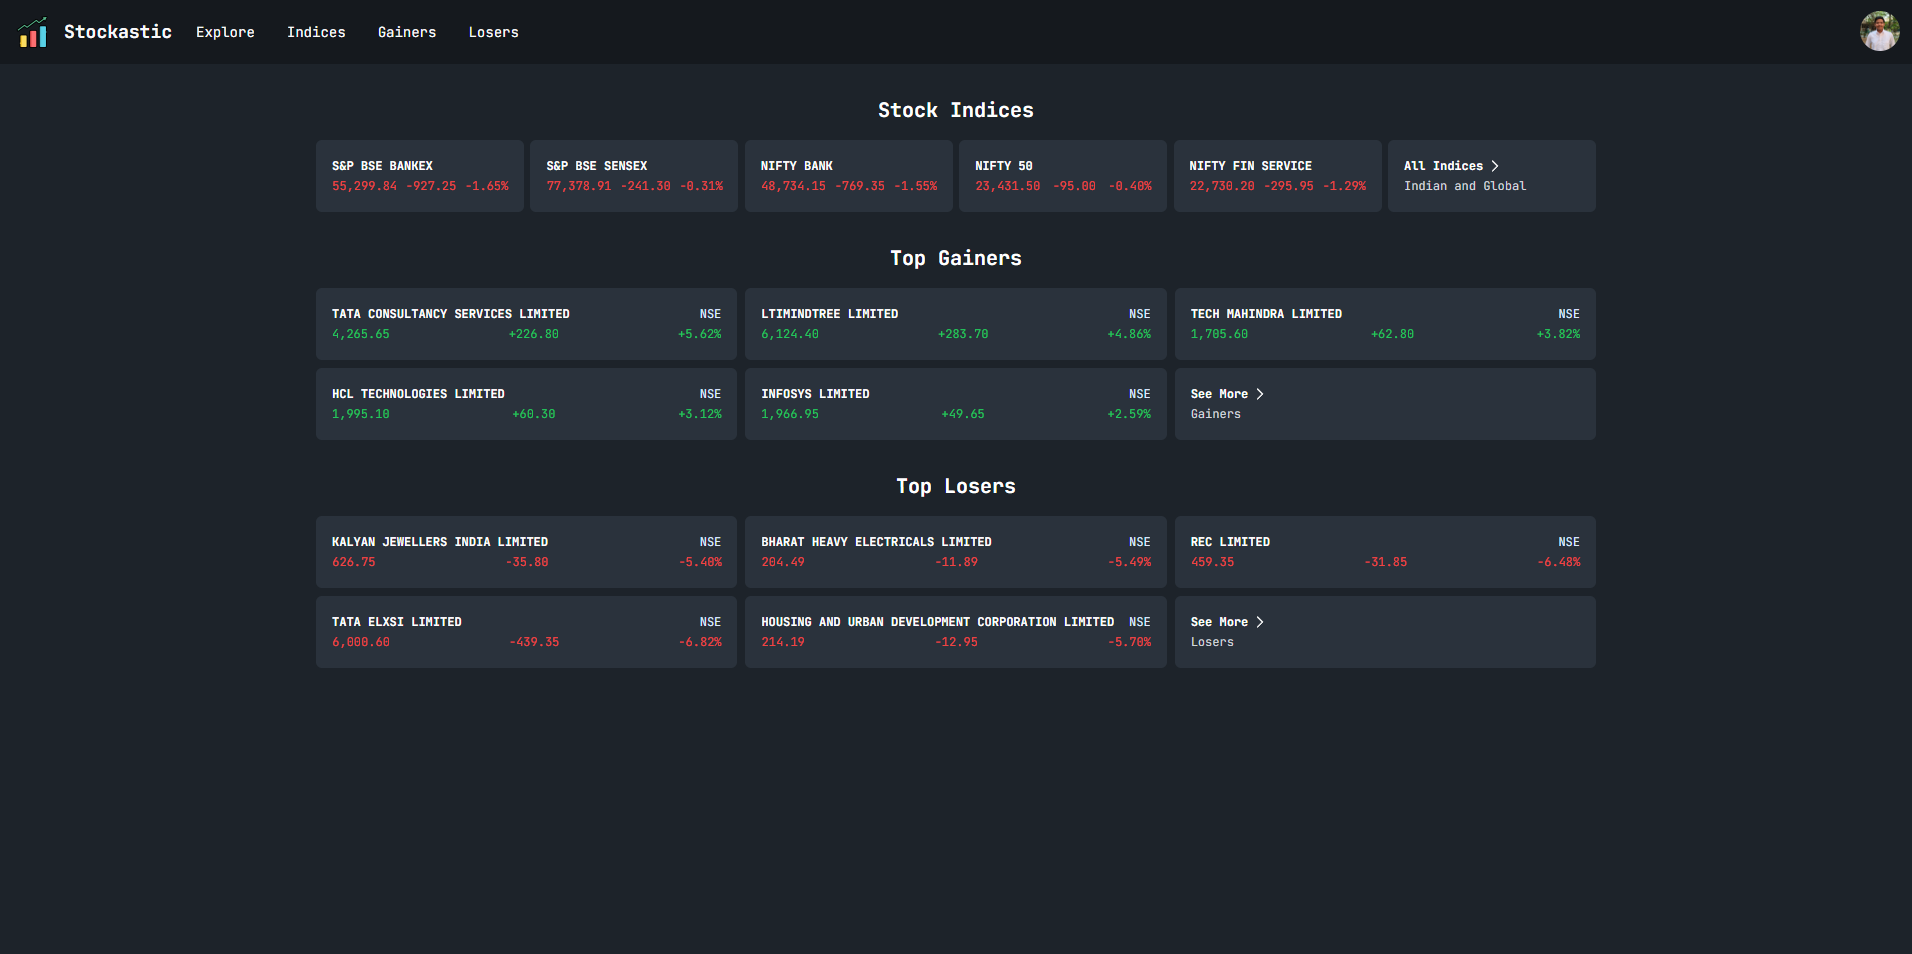
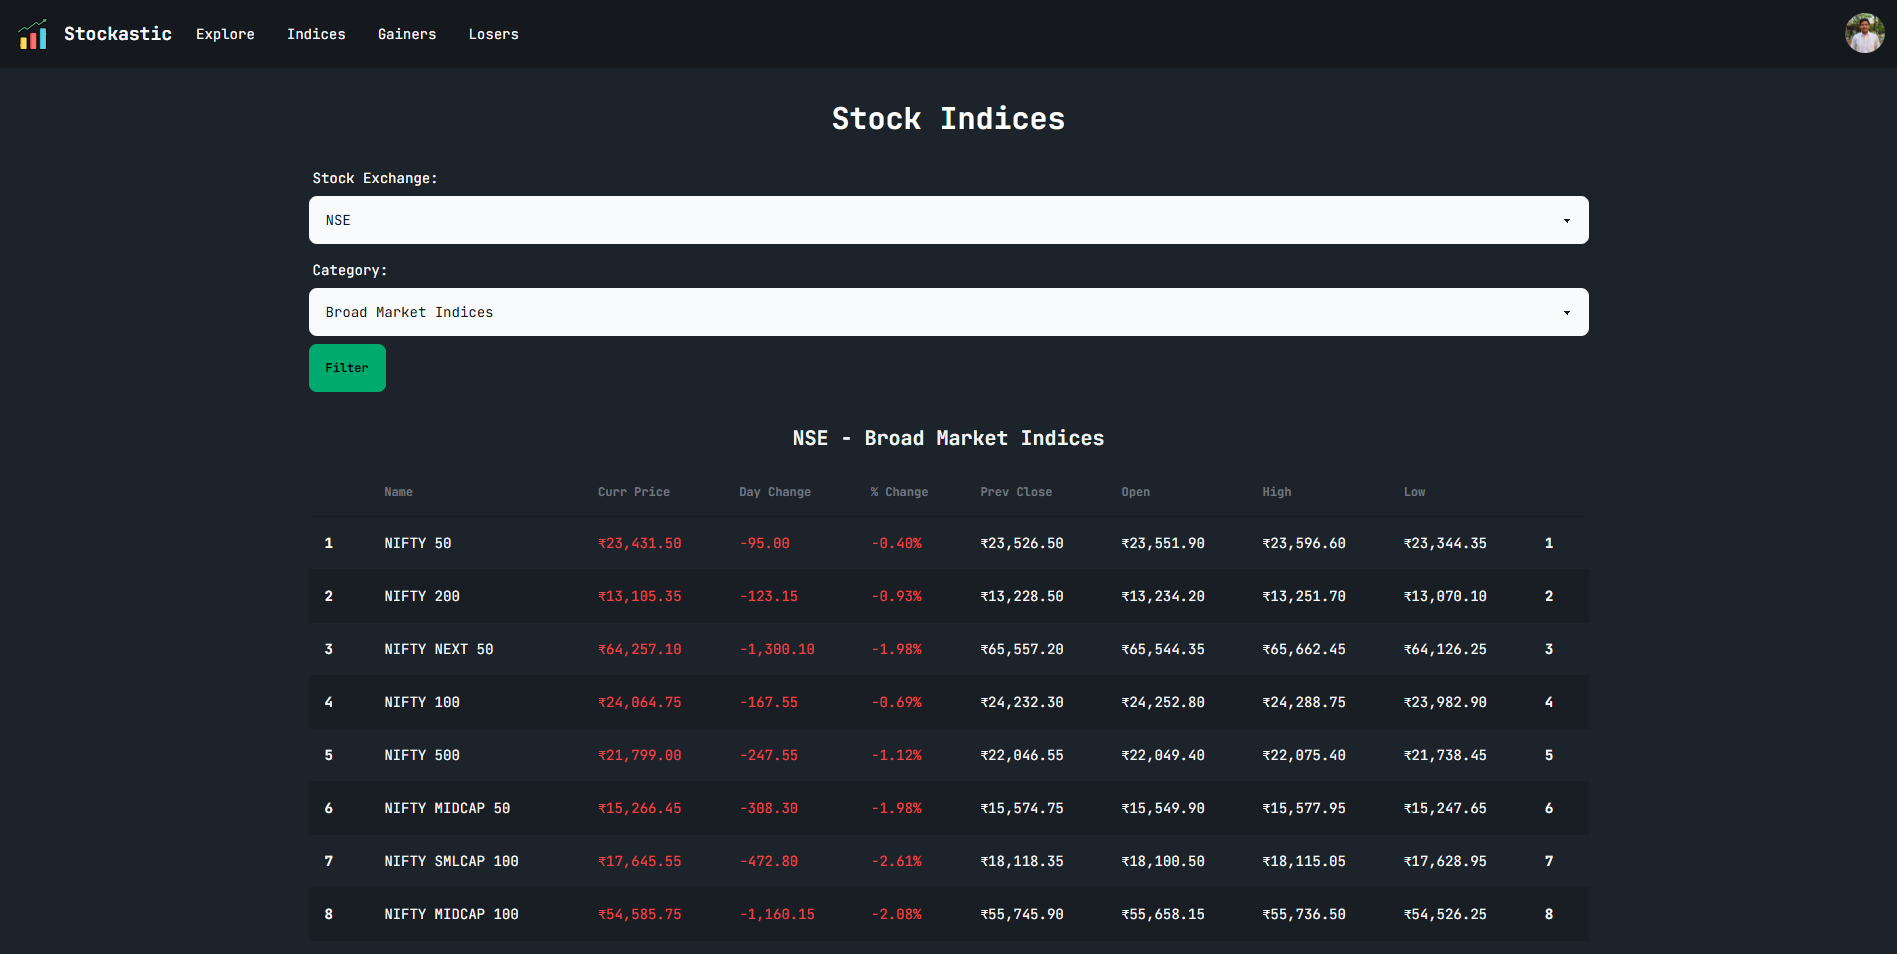
- Indices tracking
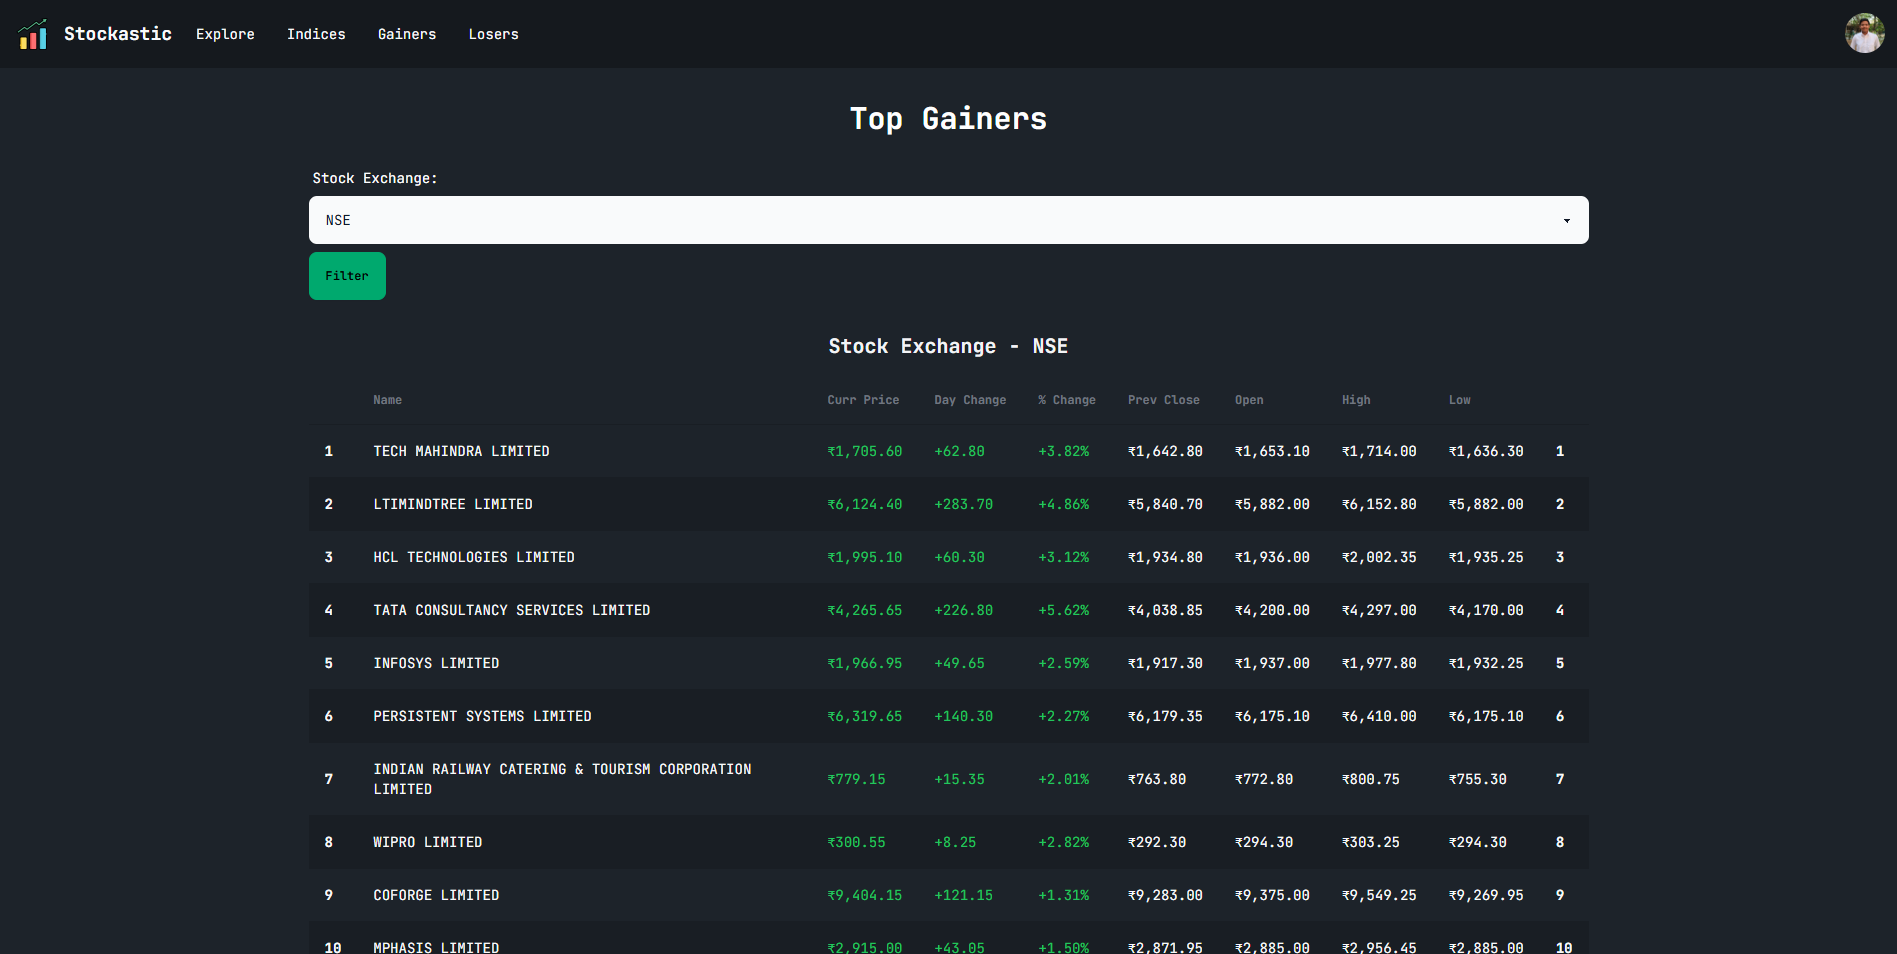
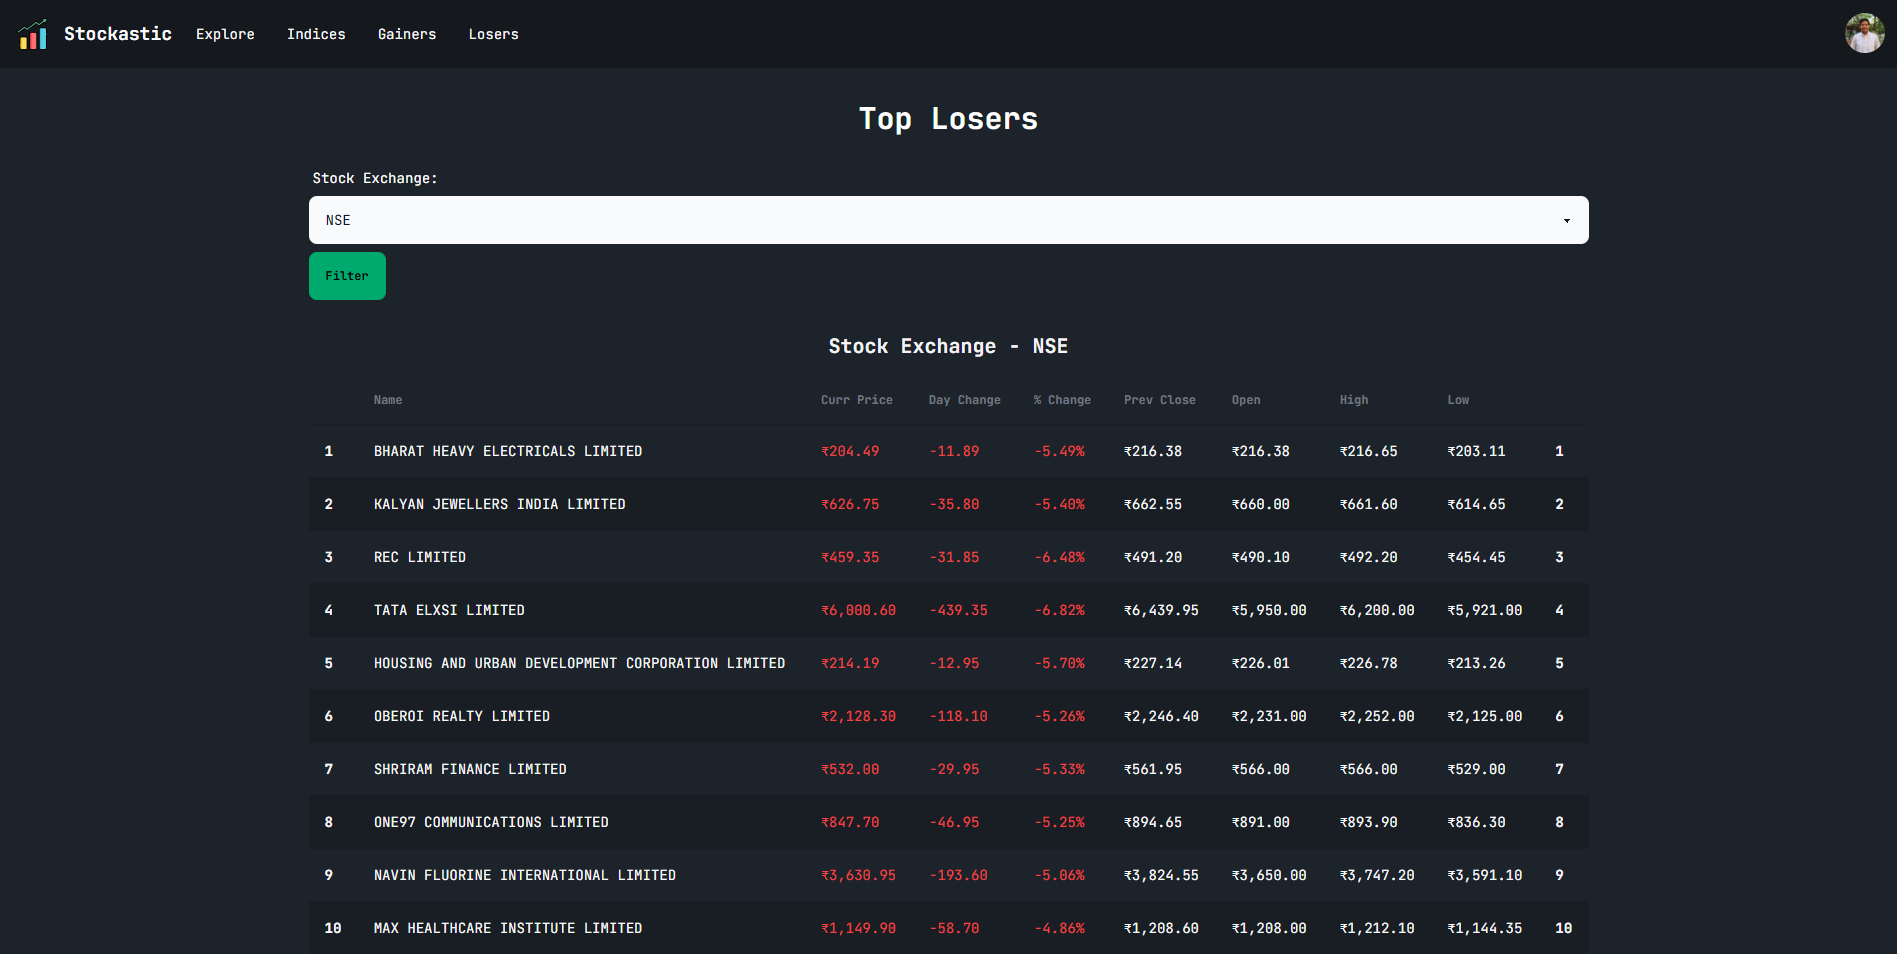
- Top gainers and losers
- BSE and NSE equity stocks
- Interactive Visualization: Plotly-powered charts for detailed market analysis
- Smart Stock Management:
- Bookmark/unbookmark stocks and indices to track favorites
- Advanced playground mode for technical analysis
- Dual Exchange Support: Toggle between BSE and NSE for equity stocks
- Multiple Index Categories: Various index options sourced from NSE Python and BSE website
- Modern UI/UX: Responsive and intuitive interface styled with Tailwind CSS and DaisyUI components
- Historical Data Analysis:
- Customizable time periods (1d, 5d, 1mo, 3mo, 6mo, 1y, 2y, 5y, max)
- Flexible intervals (1m, 2m, 5m, 15m, 30m, 60m, 90m, 1h, 1d, 5d, 1wk, 1mo, 3mo)
- 40+ Technical Indicators including:
- Moving Averages (SMA, EMA, WMA)
- Oscillators (RSI, MACD, Stochastic)
- Volatility Indicators (Bollinger Bands, ATR)
- Volume Indicators (OBV, Volume Profile)
- Trend Indicators (ADX, Parabolic SAR)
- Interactive Visualization:
- Overlay multiple indicators
- Dynamic chart updates
- Customizable indicator parameters
- Interactive Plotly charts for each index/equity stock
- Detailed view combining charts with comprehensive stock information
- Real-time data updates through WebSocket connections
- Technical analysis visualization in playground mode
- Django 4.2.17
- Python 3.13.1
- WebSockets (websockets 14.1)
- Plotly 5.24.1
- Redis 5.2.1
- Tailwind CSS 3.4.1
- DaisyUI 4.7.2
- HTML5/CSS3
- JavaScript
- PostgreSQL (Database)
- MinIO (Storage)
- Nginx (Web Server)
- NSE Python (2.94)
- yfinance (0.2.51)
A comprehensive list of Python dependencies is maintained in requirements.txt. Key packages include:
- Django and related packages (django-cors-headers, django-redis, etc.)
- Data processing tools (pandas, numpy)
- Visualization libraries (plotly)
- Technical analysis libraries (ta)
- WebSocket support
- Database connectors
- Development and testing utilities
- Fork the repository
- Create your feature branch (
git checkout -b feature/AmazingFeature) - Commit your changes (
git commit -m 'Add some AmazingFeature') - Push to the branch (
git push origin feature/AmazingFeature) - Open a Pull Request
This project is licensed under the MIT License - see the license file for details.
- NSE Python library contributors
- yfinance maintainers
- Django community
- TA contributors
- Tailwind CSS team
- DaisyUI contributors
- All contributors who have helped shape this project
